 Vladyslav Zakharovskyi1
 Károly Németh
- 1School of Agriculture and Environment, Massey University, Palmerston North, New Zealand
- 2Lithosphere Physics Group, Institute of Earth Physics and Space Science, Sopron, Hungary
- 3The Geoconservation Trust, Aotearoa Pacific, Ōpōtiki, New Zealand
- 4National Earthquakes and Volcanoes Program, Saudi Geological Survey, Jeddah, Saudi Arabia
- 5Istituto Nazionale di Geofisica e Vulcanologia, Bologna, Italy
Unexpected natural hazardous events can lead communities to create preparedness plans and identify risks associated with future devastating events. In the case of Cyclone Gabrielle, which resulted in catastrophic damage throughout the North Island of New Zealand, we recognised a need for models that could define the most hazardous areas in the Coromandel Peninsula with respect to the potential risk of hazardous influences on the anthroposphere as shaped by geodiversity. In this research, we utilise a qualitative-quantitative methodology for the assessment of hazard susceptibility applied to locations with varying levels of geodiversity on the Coromandel Peninsula. Because most of the geological sites displaying high values are located near cliff sides and/or along valleys, they are likely to align with hazardous areas. Utilising the same methodology for the recognition of two different parameters will provide an opportunity to compare results to find a potential similarity and/or correlation between geological locations and hazardous zones. Meanwhile, a flood prediction model has been analysed along with hazard susceptibility to recognise potential risks in the anthropological sphere (presented as buildings) on the Coromandel Peninsula. Our research results demonstrate a significant correlation between hazard susceptibility and geodiversity models, while flood prediction models together with the hazard model define vulnerable regions in the event of future natural events on the Coromandel Peninsula.
Introduction
In February 2023, tropical Cyclone Gabrielle produced widespread damage in Australia, Vanuatu, and the North Island of New Zealand. The cyclone caused a catastrophic deluge over wide areas of the North Island of New Zealand, such as Northland, Auckland, the Coromandel Peninsula, and Hawke’s Bay. Concurrently, it brought high winds and flooded rivers to the Manawatū, Whanganui, and Marlborough regions (Figure 1). The cyclone’s disastrous effects resulted in catastrophic damage in some areas, where houses were destroyed and multiple landslips were caused by a precipitation rate of 200–400 mm per 12 h (Martin, 2023). An estimated 10,000 people were displaced, 365 were injured, and several deaths occurred. On the Coromandel Peninsula, the effects of Cyclone Gabrielle were exacerbated by already saturated catchments and high groundwater levels, due to falling at the end of one of the wettest summers on record (Guardian, 2023; Habitat, 2023; McConnell, 2023; Nick et al., 2023; RNZ, 2023; Trevett, 2023; Wikipedia, 2023). Hence, this cyclone and its effects have resulted in changes to the biotic and abiotic environment, in addition to social and economic impacts that may be felt for generations to come.
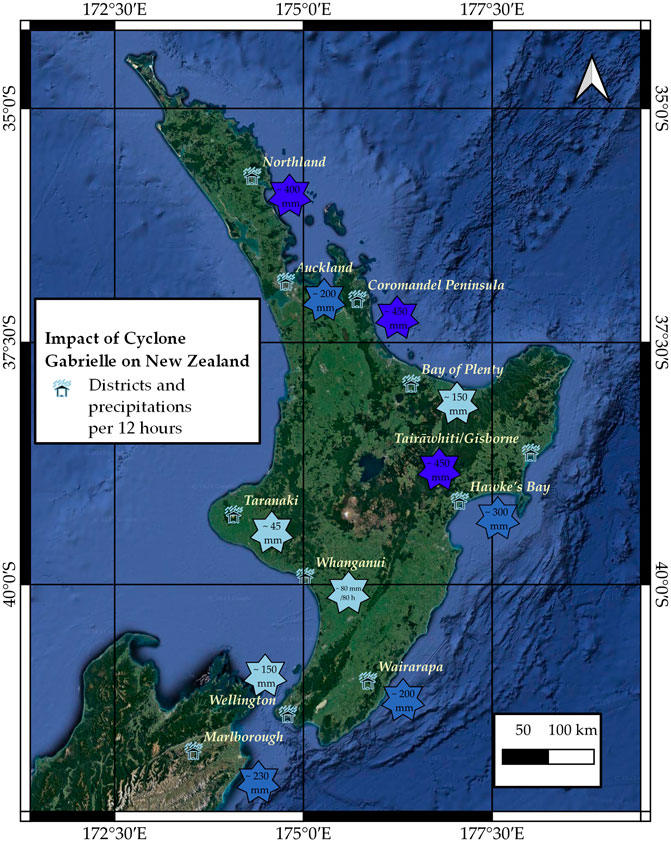
FIGURE 1. Overview model of the impact of Cyclone Gabrielle on New Zealand. The stars show the precipitation rate in mm per 12 h, with the darker blue indicating the higher rate (Martin, 2023).
High precipitation rates (200–400 mm per 12 h), such as those observed during the cyclone, will inevitably influence the natural environment, provoking extreme river flows overtopping natural banks and man-made stop banks. At the same time, the increased water velocity will gather and transport significant amounts of alluvial material from the bottom of the channel, riverbanks, and terraces. Along with rainfall, the transportation of the material can provoke land sliding, which in turn can reshape the biosphere and anthroposphere, creating hazardous situations. For example, it increases land degradation in farming areas, damaging human and animal habitats in the upper flows of rivers. In addition, the river flood transfers all the nutrients to its way to the river mouth, where they fall into the ocean, sea, or lake, harming marine life due to the increase in CO2 concentration (Stets et al., 2017). Overall, the high precipitation rate can lead to irreversible changes in the environment, especially over river terraces, which can then have an impact well beyond the immediate surroundings of these terraces, leading to a potential risk of degradation of geosites (Gordon et al., 2022). However, exaggerated rates of erosion can also have some positive influences on the abiotic environment. New outcrops can be exposed at the surface, and a history recorded in the landscape of rivers shows the changes and geological evolution of affected locations driven by climate as an agent for geoheritage formation (Gordon et al., 2022). Moreover, nutrient and silt deposition transferred to floodplains is a trigger for the establishment of human communities, as these provide fertile platforms for agriculture (Di Baldassarre et al., 2013).
Through geoeducation and geological tourism, new opportunities can be created for researchers to establish new geolocations (Gray, 2008a; Kozłowski, 2004; Serrano and Ruiz-Flaño, 2007; Zwoliński et al., 2018; Zakharovskyi and Németh, 2021b). Geoeducation is a facet of the broader subject of geodiversity, which aims to describe the abiotic nature of the location being studied and make it accessible for tourism and students (Farsani et al., 2011; Brocx and Semeniuk, 2019; Zafeiropoulos et al., 2021). Geodiversity itself describes the importance of the abiotic environment by understanding the interconnectedness of elements such as geology, geomorphology, hydrology, soils, climate, and human and biological influences (Zakharovskyi and Németh, 2022a; Zakharovskyi and Németh, 2022b; Zakharovskyi et al., 2022c). Geosites and their associated geoheritage are subject to more specific descriptions, which reinforce the recognition of valuable locations for different purposes. “Geosite” refers to a location that contains some unique qualities that contribute to the description of the geodiversity of the region studied. Meanwhile, the term geoheritage is applied to locations that are able to record periods of the geological evolution of that area. Reviewing the current literature, it appears that most researchers in this field are concentrating on the assessment and description of abiotic elements in order to justify the establishment of geosites and geoheritage locations within geoparks as an ideal framework for geological and geomorphological education.
The most popular method of geodiversity assessment is quantitative (Pereira et al., 2013; Silva et al., 2013; Reynard and Brilha, 2017; Bétard and Peulvast, 2019), which focuses on the description of the environment and utilises large amounts of data, mostly presented as a series of geological, geomorphological, hydrological, anthropological, archaeological, soil, and other maps and models (Gray, 2004; Kozłowski, 2004; Serrano and Ruiz-Flaño, 2007; Gray, 2008b; Brilha et al., 2018). The result of the quantitative type of assessment is a geodiversity model, which shows the concentration of abiotic elements in the research area. The main advantage of this type of assessment is the high rate of objectivity and utility in calculating values for large territories. The main drawback of quantitative assessment is its dependence on the amount and accuracy of the data required for the calculation, which can vary throughout the world and even within regions and localities. Therefore, a lack of data can be problematic for the assessment of areas like the Coromandel Peninsula, New Zealand (Zwoliński et al., 2018). Other researchers use a purely qualitative methodology (Gordon and Barron, 2013; Gray, 2013) or a combined qualitative-quantitative methodology (Perotti et al., 2019; Zakharovskyi and Németh, 2021a; Ahmadi et al., 2022; Zakharovskyi and Németh, 2022a; Zakharovskyi and Németh, 2022b) for their geodiversity assessment and to define locations of scientific, cultural, economic, aesthetic, spiritual, and/or other importance (Gray, 2004). The former is strictly based on an expert’s knowledge of the territory, where a researcher identifies and justifies specific areas for their importance based on their field of study (Zwoliński et al., 2018). A negative aspect of this methodology is its high subjectivity, as individual researchers may be subject to bias driven by their own interest in the area, which in extreme cases may result in disagreements and conflicts of interest with other colleagues in the same and/or different fields. The last method is a combination of the previous two, described as qualitative-quantitative (Perotti et al., 2019; Zakharovskyi and Németh, 2021a; Zakharovskyi and Németh, 2021b; Ahmadi et al., 2022), which combines expert knowledge and analytical data, resulting in geodiversity models that are more based on the evaluation system provided by researchers and less dependent on the amount and quality of the input information (maps, models, literature reviews). For our research, we utilised the combined method of qualitative-quantitative assessment based on globally accessible standard data (for the quantitative aspect) and an evaluation system using the provided data (for the qualitative part). However, using broad data, such as global patterns of rock type for geology and slope angle for geomorphology, means that localised specifics of the assessed region may be missed. Nonetheless, the current development of Qualitative-Quantitative assessments of Geodiversity (QQG) allows researchers to compare different regions around the world due to the user-friendly methodology, open-access software, and publicly available data used for calculations.
The QQG methodology is based on a geodiversity assessment, which is tailored to identify high-value locations based on an evaluation system that defines areas with the highest values as potential geosites. The primary aim of the methodology is to identify hotspots according to the evaluated data included in the assessment. Broadly speaking, this methodology utilises geodiversity elements to identify locations with the highest values (potential geosites). Hence, geology and geomorphology are the main elements of the geodiversity assessment, creating the core parameters of the abiotic nature, while other abiotic elements like hydrology, anthropology, climate, etc., represent the local uniqueness. Here, geological elements are generally evaluated by the rareness rate of standard rock types spread over the surface of the Earth. Meanwhile, geomorphological elements are expressed as slope angles, which is only one of several ways to represent the surface and is considered sufficient for geosite recognition. A high slope angle is likely to represent the location of an outcrop that is acceptable for scientific description and further explanation. Hence, a high geodiversity value is likely to point to the location of an outcrop of a rare rock formation. However, as previously acknowledged, the broad and general nature of this methodology has been created as a first step to minimise expensive and time-consuming fieldwork while still allowing for the identification of areas with locally unique qualities that would benefit from more in-depth and higher resolution of direct observations. In conclusion, the QQG assessment is a useful tool that can facilitate the first stage of assessment for geosites, especially in remote and/or previously unstudied areas.
The main aim of our research is to compare the qualitativequantitative geodiversity model with a risk model to define the overlay between potentially hazardous and high geodiversity value locations on the Coromandel Peninsula. The relationship between the location of geosites, relevant landscape elements (e.g., cliffs, high-angle valley slopes) as well as the specific weathering and erosional features shaping the landscape form the basis of our research to pinpoint potential geosites in the research area. Hence, geological sites are likely to be at risk of degradation under the pressure of natural events, with the Coromandel Peninsula providing a good example of geologically important locations in New Zealand that are highly influenced by alteration, weathering, and erosion. Additionally, the assessment also takes hazard susceptibility and flood models of the Coromandel Peninsula and aligns them with the anthropological sphere and areas damaged by Cyclone Gabrielle. We demonstrate whether it is possible to use our models to predict areas at high risk should they be subject to a similar or more powerful weather event.
Study Area
We have selected the Coromandel Peninsula for our assessment of geodiversity and geohazard susceptibility. It is located in the northeastern part of the North Island, New Zealand, and is formed by a peninsula approximately 150 km long and 40 km wide (Figure 2). The peninsula encloses the Hauraki Gulf to the west and is bordered by the Bay of Plenty to the southeast (Homer and Moore, 1992; Hayward, 2017). Based on our previous research, we selected this area for our geodiversity investigation as it contains diverse geological and geomorphological landforms featuring sedimentary and volcanic rocks formally grouped into different rock assemblages from plains and hills to mountain ranges and cliffs (Zakharovskyi and Németh, 2021b; Zakharovskyi and Németh, 2022a; Zakharovskyi et al., 2022c). At the same time, this area was one of the most severely damaged by Cyclone Gabrielle, so while acknowledging the damage to people’s property and livelihoods, it nonetheless provides an important opportunity to analyse and compare hazard susceptibility (mainly landslides and flooding) with geodiversity.

FIGURE 2. A digital elevation model of the Coromandel Peninsula based on the NZ 8m Digital Elevation Model (LINZ Data Service, 2012).
Geomorphology of the Coromandel Peninsula
The geomorphological elements of the Coromandel Peninsula feature a diversity of landscape types and forms, with elevations ranging from 0 to approximately 900 m above sea level (Booden et al., 2012) (Figure 2). The southwestern region of the peninsula features near-sea-level plains, with elevations increasing as the plains give way to rolling hills that form the foothills of the mountainous Coromandel Range, which forms the backbone of the peninsula. The range runs along the central west of the peninsula, turning north to Fletcher Bay. The eastern region, featuring beaches and cliffs, is far more influenced by marine activity and coastal processes than the western region. With the highest altitude in the eastern region being 350 m above sea level, the region itself is much closer to sea level. The diversity of geomorphological elements of the Coromandel Peninsula is shaped by volcanic-marine events that occurred from the Mesozoic through Pleistocene, followed by sediment deposition that occurred through the Holocene (Hayward, 2017) (Figure 3). Hence, the geomorphological diversity of the Coromandel Peninsula provides a record of volcanic events followed by sedimentation, thereby resulting in landscape forms such as plains, valleys, hills, mountain ranges, and cliffs. However, current research has not found a geomorphological map/model of the Coromandel Peninsula, so we have created the best possible representation with the Geomorphons tool of QGIS (Saga plugin) (Stepinski and Jasiewicz, 2011; Jasiewicz and Stepinski, 2013), which we calculated with default parameters. The model describes 10 landforms based on the differences in elevation between the calculated pixel and its neighbors. As a result, we have a model with the following landforms: flat, summit, ridge, shoulder, spur, slope, hollow, footslope, valley, and depression (Figure 4). However, this model was not used in the QQG assessment because of the difficulty in evaluating the landforms (Zakharovskyi and Németh, 2022a). Therefore, we utilised a slope angle model as the geomorphological element for geodiversity assessment, with further information on slope and evaluation provided in the Methodology section.

FIGURE 3. Geological model of the Coromandel Peninsula based on the 1:250,000 scale New Zealand Geological Map (GNS, 2012). Hydrothermal alteration data were extracted from the GNS database (Edbrooke, 2001).

FIGURE 4. Geomorphon model of the Coromandel Peninsula based on the NZ 8m Digital Elevation Model (LINZ Data Service, 2012). Default calculation parameters: Threshold—1; Radial limit—10,000; Method—line racing; Multi Scale Factor—3.
Geology of the Coromandel Peninsula
The geological elements of the Coromandel Peninsula feature remnants of volcanic-marine activity from the Late Mesozoic era to the Late Pleistocene period, with some areas subject to hydrothermal alteration and sedimentation. The basement of the Coromandel Peninsula is formed by Triassic—Jurassic greywacke, part of the Waipapa Composite Terrain that is a mildly metamorphic marine sedimentary rock, which is also the oldest exposed rock unit within the study area (Mortimer et al., 2014; Mortimer et al., 2017). In addition, this formation contains a series of dikes formed by Neogene igneous rocks exposed to the north. Emergent greywacke in the northwestern part of the peninsula forms gradually rolling hills. The Coromandel Group of volcanic rocks is mainly composed of andesite and dacite extrusive rocks that are spread over the length of the peninsula, forming the Coromandel Ranges with altitudes ranging from 150 to 900 m in the central ranges (Briggs and Fulton, 1990; Homer and Moore, 1992; Adams et al., 1994; Malengreau et al., 2000; Nicholson et al., 2004; Smith et al., 2006; Booden et al., 2012; Hayward, 2017). Additionally, the Coromandel Group contains extensive hydrothermal alteration (Mcu) in the north and moderate alteration (Mci) in the south. This group also contains the intrusive rock type known as Coromandel Granodiorite, one of the rarest rocks in the world (less than 1% exposed on the surface for Cenozoic intrusive rocks) according to Proportions of exposed igneous, metamorphic, and sedimentary rocks (Blatt and Jones, 1975), located in the northeastern part of the Coromandel Peninsula. The next largest geological formation is the Whitianga Group (Pliocene-Pleistocene period), which features rhyolite and ignimbrite and is found in the central and southeastern parts of the peninsula. In addition, this group contains extensive alteration (Mhm) spread throughout the eastern part of the formation. The last volcanic group is the Neogene igneous rocks of the Mercury Basalts, which form the Mercury Islands and some local formations found on the eastern shores. The Te Kuiti Group limestones are found in a few locations in the northeast. The remaining geological formations are comprised of a range of sedimentary rocks from the Miocene to the Holocene periods and are found mainly in the valleys leading to the coast. In summary, the geological elements of the Coromandel Peninsula are formed by marine volcanic activity represented by the Coromandel and Whitianga Groups, which emerged through the basement greywacke mudstone. Meanwhile, hydrological processes acting on these formations have deposited sediments from the Miocene to the Holocene periods and continue to do so.
Hydrology of the Coromandel Peninsula
The hydrological elements of the Coromandel Peninsula are represented by 487 streams and creeks and 246 lakes distributed throughout the study area based on NZ Lake Polygons (Topo, 1:50k) (LINZ, 2023b) and NZ River Centrelines (Topo, 1:50k) (LINZ Data Service, 2022a). Most waterways originate at high points in the Coromandel Ranges, flow into the coastal areas of the peninsula, and discharge into the ocean. Lakes are relatively small, with an average area of 4,282.7 m2, the largest lake being 202,279 m2 in the southern part of the Coromandel Range (Figure 5). They are mainly spread in the central and eastern regions of the peninsula. We have applied the Strahler order methodology to the Digital Elevation Model (DEM) and defined real and possible sources. Where two waterways of the same order merges together produce a new higher order waterway. When a channel merges with lower order channels the new channel order remains the same as the original higher value channels (Zakharovskyi et al., 2023). Therefore, the highest order for the Coromandel Peninsula is 6, located in the central-eastern region, where the Waiwawa and Whenuakite rivers flow into Whitianga Harbour (Figure 5). The remaining rivers are mainly fifth-order and are located in the southwestern and central-east parts of the region. In summary, the hydrological elements of the Coromandel Peninsula can be defined as weakly developed, justified by the high differences in elevation over a relatively small regional area, therefore providing minimal situations in which rivers and their catchments can develop to maturity.

FIGURE 5. Hydrological model of the Coromandel Peninsula based on the NZ 8m Digital Elevation Model (LINZ Data Service, 2012). * - The largest lake on the Coromandel Peninsula is 202,279 m2.
Anthroposphere of the Coromandel Peninsula
Large areas of the Coromandel Peninsula are covered by a range of habitats and ecosystems, some relatively original, while others are natural but modified to some degree, with the majority under the control of the Department of Conservation (DOC) based on Protected Areas (LINZ Data Service, 2022b). A stated and explicit goal of this agency is to protect the region’s flora and fauna, hence the minimal infrastructure in many of the areas under its management. The management of the Coromandel Peninsula can be divided into two broad districts: Thames-Coromandel and Hauraki (Figure 6). However, the peninsula does not have a strict boundary in the geographical sense, so some areas defined as Western Bay of Plenty and Matamata-Piako have been included in the assessment due to their descriptions in the NZ Building Outlines LINZ dataset (LINZ, 2023a). The Thames-Coromandel district is the most populated area of the central region, with 50,238 buildings, and includes the towns of Thames, Whangamata, Pauanui, Tairua, Whitianga, and Coromandel. In contrast, the Hauraki District contains 15,240 buildings, with only the two main settlements of Paeroa and Waihi. The Western Bay of Plenty has 8,577 buildings and includes the population centres of Waihi Beach and KatiKati. Finally, our assessment includes part of the Matamata-Piako district with 2,827 buildings and the one-centred township of Te Aroha. Overall, our Coromandel Peninsula assessment area has 11 main towns, some small villages, and single isolated houses, mostly spread across the southern plains and coastal areas, altogether comprising 76,882 buildings.
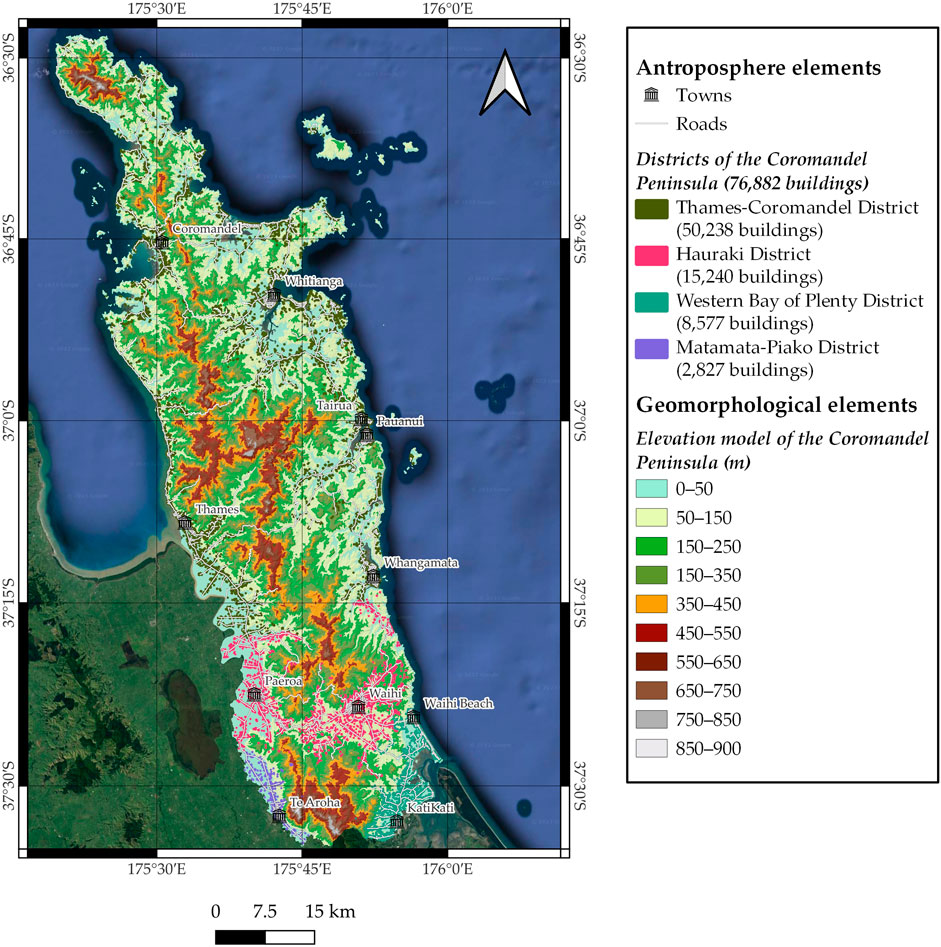
FIGURE 6. Anthroposphere elements of the Coromandel Peninsula based on the NZ Building Outlines (LINZ, 2023a). Colours indicate buildings belonging to a district, while some buildings can be separated from the rest.
Methodology
There is currently no accurate and up-to-date inventory of geosites that can be found throughout the Coromandel Peninsula. Some areas can be found listed on the New Zealand Geopreservation Inventory website (NZGI, 2019) and/or recognised through the scientific literature, which is mostly only accessible to researchers. Therefore, the development of a new methodology utilising the minimum available data (geological map only) and accessible and user-friendly software (QGIS) was our starting point for the assessment and recognition of geologically important locations in this area. This was then compared with existing New Zealand Geopreservation Inventory (NZGI, 2019) data from our previous research (Zakharovskyi and Németh, 2022a). For our calculation of geodiversity, we utilised a Qualitative-Quantitative assessment of Geodiversity (QQG), which concentrates on identifying potential locations for geosites defined by a set of parameters. The qualitative aspect of our methodology is based on an evaluation system (Zakharovskyi and Németh, 2021a; Zakharovskyi and Németh, 2021b; Zakharovskyi and Németh, 2022a; Zakharovskyi and Németh, 2022b) that has been developed up to an 8-point scale. This 8-point system is described in more detail in the following sections, where each element of geodiversity chosen for assessment is defined more precisely. The quantitative aspects of our assessment at this stage of development are based on three physical parameters (geology, geomorphology, and hydrology) and applied to landscape elements within our area of study. Geology and geomorphology are considered the core parameters that can describe the Earth’s surface, thereby justifying their position as the core elements used to assess and describe geodiversity. Meanwhile, hydrology is the additional parameter in the context of geodiversity that acts on a landscape by filling depressions and eroding elements of the landscape. Therefore, we consider it a force acting on already-present landscape features rather than a core element driving the creation of landscapes and associated features. This methodology is not a pure geodiversity assessment, as its purpose is not to describe geodiversity but rather to use its elements to highlight the location with the highest values based on an evaluation system to minimise the search area for potential geosites. The methodology has been created for the assessment of regions with a low amount of scientific information presented in geological and geomorphological data. Meanwhile, the model’s flexibility and simplicity allow the researcher to include as much data as possible about our study area in the assessment, which we have presented in previously published studies (Zakharovskyi et al., 2023; Zakharovskyi et al., 2023).
Geological Elements (Rock Age, Dikes, Faults)
Geological elements have been evaluated and described with an 8-point system based on Proportions of exposed igneous, metamorphic, and sedimentary rocks (Blatt and Jones, 1975). This work is based on the relative abundance of the major rock types found on the Earth’s surface as a whole, with rarer rocks on the surface given a higher value. The most common rock types are sediments from different ages, with the exception of Precambrian, which is one of the rarest (Zakharovskyi and Németh, 2022a; Zakharovskyi et al., 2023) (Table 1). Therefore, one point is assigned to the sedimentary Cenozoic, two points to the sedimentary Mesozoic, and three points to the sedimentary Paleozoic. The middle values are applied to Precambrian metamorphic rocks, with some rarer types receiving four points. Meanwhile, all volcanic rocks have high values, such as Intrusive Cenozoic with five points, and Extrusive Cenozoic and Mesozoic with six and seven points, respectively. The rarest rock types are given the highest value in the 8-point framework, as they make up less than 1% of the Earth’s surface. These very rare rock types are Precambrian sedimentary, metamorphic, and intrusive (Cenozoic, Mesozoic, and Paleozoic), and extrusive (Paleozoic and Precambrian). The rareness factor is an objective way of evaluating the types of rock that have emerged on the surface and is suitable for making broad comparisons between different regions of the world, as any place on Earth will fall under one of the eight categories mentioned above. However, the system has some shortcomings, especially in details such as minerals, fossils, and other geological features. These details can be applied to a qualitative assessment of geodiversity, while we utilise a qualitative-quantitative methodology that aims to describe geodiversity hotspots as areas featuring specific outcrops that can be subjected to further description and establishment as educational and tourist points. Additionally, the framework is open to the inclusion of further information about faults and dikes as they contribute to the local uniqueness of the region. Faults add additional value to the rock formation they crosscut by increasing its value by one point. Geological features such as dikes and other intrusions can also be added for the evaluation method to further refine the valorisation of the rock types they intruded. Therefore, the QQG assessment uses the 8-point evaluation system for geological elements based on the general rareness of rock type, which can be applied to any location on the Earth’s surface, while dikes and faults have been included in the assessment to emphasise the local uniqueness of the geology of the Coromandel Peninsula.

TABLE 1. Geodiversity values.
Geomorphological Element (Slope Angle)
Geomorphological elements of geodiversity can be represented as different landforms and their features; however, there are limitations to using the QQG assessment as a purely objective evaluation system. The geomorphological model itself cannot be perfectly scored, as each landform may have more valuable elements than others, given the current level of knowledge. Therefore, we have selected the slope model because, although it describes one aspect of the geomorphological element, it is not connected to any specific type of formation and objectively describes the angle of the surface through the whole region. The slope model as an element of geomorphology is acceptable for evaluation and calculation as required for the main goal of our research. The usefulness of the slope model is based on its ability to indicate areas of possible outcrop due to the law of angle of repose, which states that most loose material cannot maintain the integrity of slopes if the angle is greater than 45° (depending on the type of material). An inverse form of this law can be used for hard rock formations, where locations with slopes greater than a 45-degree angle are likely to be present as clear formations accessible for further investigation and description, as most of the loose material should be located below the slope or transported to other places. However, we note that there may be exceptions to this. Slope angle is one of the most commonly used parameters for geomorphological assessment, which we have compared with other models in our previous research. The results demonstrate that slope is one of the best models for QQG assessment (Zakharovskyi and Németh, 2022a; Zakharovskyi et al., 2023). After developing the evaluation system for the slope model, the 8-point framework was applied to align it with the geological values (Table 1). Slopes of 0–11.25° are assigned a value of 1 point, 11.25–22.5 2 points, 22.5–33.75 3 points, 33.75–45 4 points, 45–56.25 5 points, 56.25–67.5 6 points, 67.5–78.75 7 points, and 78.75–90 is assigned the highest value of 8 points. After applying the evaluation system to slope values, we can use this methodology to identify geosites on the basis that a higher slope angle is more likely to represent an outcrop, which can then be defined as a potentially suitable site for geoeducation. Therefore, the geomorphological aspect of our assessment can be shown to be a simple and reliable methodology for identifying possible outcrop locations for further detailed observations.
Hydrological Element (Strahler Order)
The hydrological element of our methodology is included as an additional (but not core) value of geodiversity, as this element does not play a role in the construction of rock formations but rather fills depressions and acts as a mainly erosive agent of landscape transformation (Leopold and Langbein, 1962; Huggett, 2007; Zhao et al., 2017). The hydrological element in this assessment is represented as channels based on the calculation of the Strahler order model, which was chosen for the assessment of hydrological values. The Strahler order reflects the likely path of surface water movement in an ideal landscape (DEM-derived). It is therefore important in understanding landscape maturity to recognise that the landscape response to linear erosion of watercourses means that the abundance of higher orders reflects a landscape that is mature, and its size permits the development of a channel network with complexity (Strahler, 1957). The method has been applied to the DEM of the Coromandel Peninsula, where possible and confirmed water channels have been described and defined in the valleys and depressions. Each channel is described by its order number, where the first order is shown to be the source stream, which then becomes a second-order waterway when it merges with another stream of the same order, while lower-order channels have no influence on the system (Zakharovskyi et al., 2023). This process continues until the channel of the highest order flows into the lake or sea. For the assessment, the default order number is added to the calculation without considering the elevation. It describes the ability of a river to transport the material from the streams up to the point of discharge (Miller and Juilleret, 2020). Hence, a stream with the highest order is likely to have the greatest variety of rock material gathered within the stream from the upper flows (Langbein, 1964). This results in a model where the Strahler order has been calculated from the DEM of the Coromandel Peninsula and can then be used for our assessment (Table 1).
Hazard Susceptibility Model
The main aim of our research is to compare the hazard susceptibility of the Coromandel Peninsula with its QQG model, which is similar to Geodiversity Assessments and Geoconservation in the Northwest of Zagros Mountain Range, Iran: Grid and Fuzzy Method Analysis (Ahmadi et al., 2022), but utilising different parameters, data, research area, and evaluation system. The QQG model was developed to highlight the possible locations of outcrops of important rocks based on rarity. While using a similar pattern, we decided to apply a hazard susceptibility assessment utilising other elements with the same qualitative-quantitative methodology. A comparison can then be made between the two models to demonstrate the degree of similarity between them. The main principle is based on the idea that a geologically important location may be represented by a site of high instability and is likely to be erased by high-impact, extreme natural events. Hence, the hazard susceptibility model is based on a qualitative-quantitative methodology, where the main elements are the Unconfined Compressive Rock Strength (UCS) multiplied by values from a slope model with a 5-point system (Table 2). For additional values, we used the erosion susceptibility model with a default parameter. Hence, the UCS model demonstrates rock weakness multiplied by the slope angle model, with the higher slope degree and weaker rock formation being most at risk from the effects of extreme natural events. Meanwhile, erosion susceptibility adds more weakness points to our assessment.

TABLE 2. Hazard susceptibility values.
Unconfined Compression Test: UCS (Strengths, Dikes, Faults)
Rock strength is defined by the amount of pressure required to fracture a rock. This parameter can be inconsistent, as similar rock types can display variable strengths, as demonstrated by the amount of pressure needed to create a fracture in those rocks. Therefore, we have modified the evaluation system from Principles of engineering geology (Attewell and Farmer, 1976) to create a system fit for our purposes. As the foremost aim of our research is to compare a generic hazard model with geodiversity, we have included all the rock types found in the assessment (Table 2). Most sedimentary rocks fall into the low to middle range, with the lowest values applied to loose rocks preserved as young sediments, while older sediments such as greywacke were given low to medium values. The highest values have been applied to volcanic rocks, but many of these have been subjected to hydrothermal alteration, rendering them structurally weaker. Alteration parameters reduce the final UCS values by 1–3 points, depending on the rate of alteration. Additionally, the presence of faults reduces the rock strength value by one point. In summary, the UCS parameters provide combined strength values for each rock type, with the values also taking into account the influence of hydrothermal alteration and faults on strength.
Slope (5-Point Scoring System)
The slope model has been included as the second main element in our assessment of hazard susceptibility. Landscape areas featuring steeper slope angles are more likely to trigger landslides, rockfalls, and debris flows. Therefore, we have applied a 5-point evaluation system (Table 2) and multiplied these results by the UCS model, where the higher the slope, the higher the risk of geohazards. The lowest values were applied to a slope angle of 0–18°; low values were 18–36°; medium values were 36–54°; high values were 54–72°; and the highest values were 72–90°. However, according to data about angles of repose (Al-Hashemi and Al-Amoudi, 2018), the accumulated loose material is likely to create a fixed pile with a slope angle lower than 45°, but this depends on the type of material. Therefore, all areas with slope degrees lower than 45° can be considered stable and unlikely to flow, while steeper areas are likely to be hard rock, and their susceptibility to sliding or other types of slope failure would likely depend on the UCS values. In summary, the slope degree is used to define those areas most likely to slide or fall, with the final values adjusted using UCS strength values depending on the predominant rock type in the defined area.
Erosion
The Erosion Susceptibility Classification (March 2018) has been downloaded from the Ministry for Primary Industries database resource (Landcare Research NZ Ltd, 2018) and contains information on susceptibility to erosive processes for the Coromandel Peninsula. The default rating for erosion susceptibility is based on ESC2018, where values are divided into five categories, which have been arranged according to a 5-point evaluation system (Table 2). The category “very high”—is given five points as the most at-risk area; “high”—four points are recognised as high risk; three points are recognised as “moderate” risk; “low”—two points; and “other”—one point. However, at this broad scale, it is likely to be meaningless. Also, the category “water” has not been evaluated as the hydrological elements have been calculated separately as flood susceptibility for all hydrological surface features, which we describe in the next section. In conclusion, the erosion susceptibility parameter has been added to the hazard susceptibility assessment as an additional value and has been evaluated with a 5-point system.
Flood Calculation
In our assessment, flood calculation was executed utilising the methodology of Ian Hand (GIS and remote sensing specialist) from Using QGIS to Automate Flood Depth and Extent Data Webinar (2016). This methodology is based on the extrapolation of data at each defined point in a specially selected area utilising the Inverse Distance Weighted tool of QGIS (plugin Saga GIS) (Mitas and Mitasova, 1999). Here, we used stream data calculated with the Strahler order model of the Coromandel Peninsula in conjunction with elevation parameters extracted from the DEM. In addition, we have also used the data applied to lakes for our assessment by extracting the centre point for each lake polygon. All point data with parameters from the DEM have recognised an increase of 50 cm as a small flood for the whole area of the Coromandel Peninsula, which is unlikely to happen regionwide at the same time but possible locally. Point data was then calculated with the Inverse Distance Weighted tool. This results in the definition of possible flood areas for the Coromandel Peninsula, where water levels could increase by 50 cm. Therefore, our model provides a useful tool for checking infrastructure, residential areas, tourist attractions, and other areas that may be at high risk of flooding.
Results
The qualitative-quantitative assessment has been utilised to create geodiversity and hazard susceptibility models for the Coromandel Peninsula. Both models are based on a square grid, with each unit representing a 6.25 km2 area on the ground. The purpose of the grid is to represent data at a scale that can convey useful information on relatively small areas of high value that may not be apparent at full scale. However, as our primary aim is to define those areas of high geodiversity and high-hazard susceptibility, all grid cells are represented by the maximum value found in that cell. Hence, our results display a 6.25 km2 grid of maximum geodiversity and hazard susceptibility values for the Coromandel Peninsula.
Global and Local Geodiversity of the Coromandel Peninsula
The purpose of the qualitative-quantitative geodiversity model is to identify geodiversity hotspots across the Coromandel Peninsula, calculated by multiplying geological and geomorphological elements. This methodology is based on the global values for rock rareness and slope angle, which represent geological and geomorphological elements, respectively, but not their full description. Additionally, we included dikes and faults in our assessment (Table 1), which gives our model (Figure 7) values more weighted to specific areas of the region; we also included the Strahler order model in the assessment for an additional layer of geodiversity influenced by local hydrological elements. The results from the calculations are used to define the locations showing the high to highest values for geodiversity. We find these locations extending along the coast from the south of the Coromandel township, continuing to the north (except for the far north area), and down the east coast of the peninsula all the way to the south-east coast of the peninsula. In addition, the central areas of the peninsula also contain locations with the high and highest geodiversity values, most likely due to the presence of rocky outcrops. Meanwhile, the main part of the Coromandel Peninsula contains medium values, while the western and southern regions of the peninsula contain formations of low and lowest values and include areas where most towns are located: Waihi, KatiKati, Te Aroha, Waihi Beach, Paeroa, and Thames. Other coastal towns sit within areas of high value (except Coromandel): Whitianga, Tairua, Pauanui, and Whangamata. To summarise our results, the Coromandel Peninsula contains many areas with medium to low values for geodiversity, while the high to highest geodiversity values are found in the central-west inland and the eastern coastal regions.

FIGURE 7. Geodiversity model of the Coromandel Peninsula based on the 1:250,000 scale New Zealand Geological Map (GNS, 2012) and the NZ 8m Digital Elevation Model (LINZ Data service, 2012).
Hazard Susceptibility of the Coromandel Peninsula
Our assessment of hazard susceptibility is based on a qualitative-quantitative methodology similar to QQG. The core elements of the hazard susceptibility model are UCS and slope angle, which are evaluated according to a 5-point scoring system (Table 2). The UCS parameter of rock strength (reversed) demonstrates the weakness of a geological formation, which creates a higher risk of sliding or falling. The second main element is the slope angle, where the steeper the slope, the greater the risk of hazards caused by erosive processes. These two elements have been multiplied to provide an overall model of rock vulnerability, with locations likely to be triggered by erosive processes. Additionally, erosion susceptibility has been included in our qualitative-quantitative assessment as an additional value contributing to potential hazards. Our results have been applied to a model based on the 6.25 km2 grid system, where each cell is defined by the highest possible values for that cell. Overall, the Coromandel Peninsula is defined by medium values of hazard susceptibility (Figure 8), with the low to lowest values found in the southern regions, such as in the settlements of Waihi, Waihi Beach, KatiKati, Te Aroha, and Paeroa. The high to highest values of hazard susceptibility are found mainly in the coastal areas of the peninsula, in particular in the central-west, where we find the Thames and Coromandel townships. The east coast of the peninsula is notable for having the highest score along the whole stretch of the coast, except for the central-east coast between Whitianga and the Tairua region, but not including the towns. The townships of Whitianga, Tairua, Pauanui, Whangamata, and Thames are in areas with the high to highest hazard susceptibility. Due to accessibility and soil conditions, the central mountain regions remain to be researched in depth. Overall, our hazard susceptibility model demonstrates that the majority of the Coromandel Peninsula has a medium hazard score, with the low to lowest values found in the southern regions and the high to highest values in the mountainous central and coastal areas.

FIGURE 8. Hazard susceptibility model of the Coromandel Peninsula, based on the QQG assessment using the 1:250,000 scale New Zealand Geological Map (GNS, 2012), the NZ 8m Digital Elevation Model (LINZ Data Service, 2012), and the “Erosion susceptibility model” (Landcare Research NZ Ltd, 2018).
Additionally, our model for hazard susceptibility was applied to the locations of buildings and infrastructure on the peninsula to show the regions with the weakest rock formations for the combined geohazards outlined in this work (Figure 9). The results show that no construction has been built in areas with the highest hazard values, and only 10 are located in areas of high geohazard. Approximately 65,967 buildings have been constructed in low-hazard areas, 2,779 in medium-hazard areas, and 6,986 in locations with the lowest hazard values. Therefore, most of the settlement and building have taken place on the Coromandel Peninsula, where there is a relatively low risk of landslides and rockfalls. However, growing infrastructure and the increasing importance of land-based transportation networks are subject to rising levels of risk for several reasons (social, economic, and political) and will increasingly occur in areas subject to higher geohazards, for example near cliffs, coastlines, or areas of weak rock.

FIGURE 9. The most dangerous or high-hazard areas in the Coromandel Peninsula in terms of geohazards are based on the NZ Building Outlines LINZ dataset (LINZ, 2023a) and the 1:250,000 scale New Zealand Geological Map (GNS, 2012). Buildings located in high-hazard areas: a – 7 buildings in Kuaotunu West; b—1 building in Kuaotunu; c—1 building in Cooks Beach; d—1 building in Amodeo Bay.
Flood Areas
The flood model was generated utilising the Inverse Distance Weighted tool of QGIS (plugin Saga GIS) (Mitas and Mitasova, 1999), where the channel network and lakes were applied to the DEM of the Coromandel Peninsula. The flood model used a predicted water level rise of 50 cm to define areas likely to be adversely affected by high rainfall (Figure 10). Based on building data for the Coromandel Peninsula, out of 76,882 buildings, 31,277 (40.7%) are at risk of flooding in the event of a 50 cm water level rise in the wider Thames-Coromandel district. A total of 41.44% of buildings would be threatened by a 50 cm flood. Approximately, the same proportion (41.62%) of buildings in the Hauraki district would be subject to the same risk, while 29.5% of buildings in the Western Bay of Plenty would be at risk. Finally, 56% of buildings in the Matamata-Piako district would be at risk of damage caused by a 50 cm flood. Of particular concern is that 672,579 km of roads in the Coromandel Peninsula would be at risk in the event of a 50 cm flood, which is 33.5% of their total length (2,005.631 km). In conclusion, approximately 40% of every township could be at risk from a 50 cm flood (Table 3), as most built-up areas are located in proximity to rivers, streams, estuaries, and wetlands.

FIGURE 10. Flooded areas of the Coromandel Peninsula, or the most exposed regions to flood hazards, where the risk is highest. The model was formed from the NZ 8m Digital Elevation Model (LINZ Data Service, 2012) and the NZ Building Outlines LINZ dataset (2023a).

TABLE 3. Proportion of flooded anthroposphere.
Comparison Between Hazard Susceptibility and Geodiversity
As our geodiversity and hazard susceptibility models were constructed utilising qualitative-quantitative methods, they can be cross-referenced to each other to determine their degree of similarity and areas of alignment. Both models were represented on a 6.25 km2 grid, which utilises the maximum values found in each cell. Therefore, they clearly show values from the lowest to the highest, and the values in each model can be compared. To detect similarities, the models were overlaid to highlight the regions where areas were subject to alignment and similar rankings. The main principle behind this type of analysis is to ensure that the models show different data. As for our main elements, we utilised the same geological and slope models but different evaluation systems. The analysis shows that the QQG model for geosite recognition has 37.0% similarity with hazard susceptibility (Table 4). Furthermore, within this 37% of similar cells, 83.33% are areas with low values. The same low values are also the most common values in the southwest region yielded from both models. Furthermore, 14.43% are locations with the lowest values, mostly spread across the southern and central-eastern parts of the region. Finally, the medium values, which are the most common for the whole of the peninsula, only match in 2.23% of cases. Meanwhile, the high and highest values are similar in far less than 1% of cases, i.e., 0.014%, and 0.000192%, respectively. Hence, the similarity between the geodiversity and hazard susceptibility models only reaches 37%, with low values in the majority of the equal areas. For additional comparison, we utilised the r.covar tool in QGIS (GRASS GIS plugin) (Shapiro, 2023), which analyses input raster data and displays a covariance/correlation matrix. For the input data, we utilised a raster representation of geodiversity and hazard susceptibility models of the Coromandel Peninsula, which was represented in the previous section using 6.25 km2 of the Gird system (Figures 7, 8). The result of a correlation matrix shows a coefficient of 0.391014 between the two models.

TABLE 4. Proportion of similar values between geodiversity and hazard susceptibility models.
Discussion
Geodiversity of the Coromandel Peninsula With New Parameters
The qualitative-quantitative assessment of geodiversity was developed to maximise the information that can be extracted from elevation models and available geological maps which, for most regions on Earth, rarely have a higher resolution than 1:50,000. Valorisations or rankings provide a straightforward tool for identifying regions of potential geosites (Figure 11). Detailed analysis, which includes site visits, can then determine the exact location and significance of geosites. The assessment of geodiversity for geosite recognition has been improved compared to previous research by applying some new parameters. Using the existing geological layer, we add data for hydrological alteration, faults, and dikes. Hydrological alteration is represented in three forms, Mcu, Mhm, and Mci, which have raised the values for local geodiversity as they provide additional information on local rock formations. The same principle has been utilised for faults and dikes, but neither of these layers has influenced the rarest geological formation, which here is Coromandel granodiorite. Additionally, hydrological data expressed by the Strahler order have also been included in our assessment without evaluation, as this has already been tested in our previous research on the Manawatu Basin (Zakharovskyi et al., 2023). However, we can see that its influence in the Coromandel Peninsula was much less than in the Manawatu region, most likely due to differences in channel and basin development. While this additional information has altered the final picture of geodiversity on the Coromandel Peninsula, it has not changed it significantly. The areas with the highest values have not been changed, while the Strahler order model shows the greatest influence on flat areas, which are common in our study region.

FIGURE 11. Photograph of key geodiversity sites on the Coromandel Peninsula. (A) Tourist hotspot Cathedral Cove is a natural erosional arch carved into ignimbrite and exposed in a spectacular beach scene. The ignimbrite successions alternating with rhyolite lava domes in half sections along the coastline provide a spectacular and diverse geological environment. (B) High geodiversity is also recognised along Fletcher Bay at the northern tip of the Coromandel Peninsula, where the earliest manifestation of intermediate andesite volcanism is preserved in near-vent, proximal pyroclastic, and coherent lava successions forming headlands and cliffs. Miocene turbidity successions forming a shoreline platform along the Mesozoic greywacke landscape, (C) An important location where intrusive silicic rocks, locally referred to as the Coromandel Granite (diorite in petrographical terms), form an important geocultural site where the granite was quarried and put onto ships to be transported throughout New Zealand to be used in the construction of significant historic buildings across the country, (D) New Chumm Beach is a multiple award-winning geotourism spot and the best beach in New Zealand, forming a sandy beach along exposed intermediate volcaniclastic rocks and Pliocene columnar jointed basalt.
Hazard and Flood Susceptibility Models on Building Areas
The events that occurred in the Coromandel Peninsula due to a historically wet summer leading up to Cyclone Gabrielle, with its high precipitation rates, could be described as a geocrisis, in which many buildings and road networks were significantly damaged (Figure 12). It was this geocrisis, occurring in an area familiar through previous research (Gravis et al., 2020; Zakharovskyi et al., 2022c) that provided the impetus to create a hazard model for this region. Our model utilised three main parameters: UCS (rock strength), slope degree, and erosion susceptibility. The results of our model show that most areas of the Coromandel Peninsula have low and medium risk rates, especially in the southern and central areas of the peninsula. Meanwhile, the central area of the peninsula and its coastal areas display high to highest hazard rates (Figure 9). Although the townships of Thames and Coromandel are in hazardous areas, analysis of higher-resolution data shows that most buildings are confined to low-hazard areas. However, our calculations only assessed rock and surface weaknesses under the buildings, while significant hazard levels can be posed by exposure to landslides or rock falls, especially in coastal areas. Then, to analyse the susceptibility to flooding, a calculation of a 50 cm water level increase for all the channels and lakes in the Coromandel Peninsula demonstrated that around 40% of constructions are at risk from a 50 cm flood (Figure 10). However, such a flood is unlikely to occur throughout the whole region at the same time, so it is more realistic to consider the local risks to each catchment area on a case-by-case basis. In conclusion, the hazard susceptibility and flood models demonstrate that flooding is the most hazard likely to create significant damage to the infrastructure of the Coromandel Peninsula. Rock weaknesses in the contrary less significant hazards as most towns are not exposed the latter hazard, however main lifelines and infrastructures commonly located in those areas where rock weaknesses are critical for potential landslides.

FIGURE 12. Photos after Cyclone Gabrielle and/or other disasters on the Coromandel Peninsula. (A) Road 309 with steep, heavily altered volcanic rock-dominated sides that are prone to collapse after intense rain, (B) Landslides commonly impact stream valleys. Rebuilding also generates additional hazards as debris ends up in streams, (C) Highway 25 with steep cliffs of unstable rock, and (D) Young unconsolidated clay-rich sediments that slide easily after intense rainfall.
Relationship Between Hazard Susceptibility and Geodiversity
The relationship between geodiversity and hazard susceptibility became an obvious hypothesis after Cyclone Gabrielle made landfall on the Coromandel Peninsula in February 2023. Following the catastrophic effects of the cyclone, a landslide occurred at Cathedral Cove, one of the most iconic tourist destinations on the peninsula, so we can be justified in considering the area as a geosite (Vidyadharan, 2023). Therefore, we decided to concentrate on rock weakness by combining UCS, slope angle, and erosion susceptibility models calculated utilising qualitative-quantitative methodology. However, the results of our assessment in comparison with geodiversity differ markedly. Both models utilise slope models and rock parameters that have been subjected to linear connections; for example, slope angle is a likely indication of an outcrop (possible geosite), and at the same time, it is a high-risk location that can be triggered by a rockfall or slide, depending on rock strength. Then, the UCS (hazard susceptibility model) and rock rareness (QQG model) also demonstrate an alignment where all sediments in the Coromandel Peninsula are considered to have a low value similar to Cenozoic UCS sedimentary rocks compounded of loose material. However, for our calculations, we have used the reverse evaluation for the UCS because sediments and altered rock formations have a higher risk of movement. As an additional parameter of the hazard susceptibility model, we utilised erosion susceptibility representing the erodibility of the substrate as a reflection of the stream-flow strength. In the QQG, however we used the Strahler order model, which is somehow reflects the depositional power and maturity of the fluvial system (e.g., higher the Stahler order, the more mature and distal the river is). Areas with the highest Strahler order are mostly located in the lowest-elevation areas with relatively flat surfaces, while erosion has higher values in hilly and mountainous areas. Therefore, geodiversity and hazard susceptibility are two parameters that have some connection between their two main elements: slope angle and rock parameter. The results show a 37% (1,765.5 km2) overlap between the QQG and hazard susceptibility models (Table 4). This demonstrates that these areas should be subject to further assessment in the context of planning and management of protection, especially areas of overlapping high and highest values for both models (247,169.11 m2 and 33.9 m2, respectively), with consideration also given to areas with medium values. Furthermore, our data shows that the Cathedral Cove area has medium values for hazard susceptibility, while according to geological maps (Figure 4), it is made of strong ignimbrite rock with no alteration or faulting and a medium value from the QQG assessment. Additionally, both models have been checked by a covariance methodology r.covar tool in QGIS (GRASS GIS plugin), resulting in a coefficient of 0.391014 of the correlation matrix, which is mostly referred to as week relationship between models. Hence, our theory of a linear connection between QQG and the Hazard Susceptibility model that high Hazard rate equal to Geodiversity hotspots (geosites) is not confirmed. However, areas with high geodiversity and high hazard levels should become a focus for future assessments of geoconservation.
Future Assessments
Further research will focus on areas where geodiversity and hazard susceptibility models overlap, as these areas represent potential geosites that may be damaged, changed, or even destroyed due to another event similar to Cyclone Gabrielle. Additionally, both models provide information that can support tourism, education, civil engineering, infrastructure planning, recreational activities, and other areas of multidisciplinary research. This is therefore an important area of multidisciplinary research, especially for places like the Coromandel Peninsula, where most of the territory is managed as a conservation zone with potential geological and biodiversity value, in addition to its value as a tourist area and desirable lifestyle region from an economic perspective. It is clear from our analysis that the very qualities that make the Coromandel Peninsula an appealing location for a leisure and lifestyle economy include high geodiversity values. It translates to the fact that we have recognised that some of these also overlap with high-hazard susceptibility. This problem used to be recognised in isolated cases in the past, but it may no longer be an explicit problem due to the increased frequency of extreme weather events and subsequent geological processes. However, the leisure and lifestyle economy of the Coromandel Peninsula continues to exponentially expand, creating a typical tourism and lifestyle hotspot within this region, with this process pushing up against every natural limit. Understanding these areas at a very deep, multidisciplinary level is going to be more and more important as global and planetary changes becoming more evident everywhere on Earth. Future geoconservation frameworks should consider these changes and adopt methods to facilitate the develope unified conceptual framework of geoconservation and geohazard management utilizing geoheritage and geodiversity in various spatio- temporal scales.
Conclusion
Geodiversity
The result of our assessment of the geodiversity of the Coromandel Peninsula demonstrates that the region contains a high number of sites that must be explored and considered as potential geosites. These are mostly spread through the central inland area and the north-to-north-east coastal areas of the region. At the current level of development of the QQG assessment, the description of geological elements has been improved with information on faults, dikes, and areas of hydrothermal alteration. Subsequently, hydrological elements demonstrated by the Strahler order have been included in the assessment but have not had a major influence on the resulting model. Overall, our current geodiversity assessment has been improved with more additional information, making the result more accurate and informative.
Hazardous Areas
Cyclone Gabrielle was a significant event that prompted us to create the hazard susceptibility and flood prediction models for the Coromandel Peninsula and apply them to the current infrastructure of the region. The result demonstrates that most construction is in the areas with the low and lowest hazard values, but there is potential for landslides or rock falls from nearby locations, especially in areas of the Coromandel township. Meanwhile, the flood prediction model demonstrates that a 50-cm water rise can potentially damage approximately 40% of the buildings, as most of the towns are located on or near rivers. In conclusion, the threat of flooding can potentially cause much more damage to constructions than slides or rockfall, but these also can be triggered by rising water levels.
Hazard-Geodiversity
The comparative assessment of the geodiversity and hazard models demonstrates similarities in 37% of the territory of the Coromandel Peninsula area, with some linear connections between the two models. However, 37% of the similarities mostly relate to low and lowest values. Additionally, the correlation coefficient between the QQG and hazard models is 0.391014, demonstrating weak relationships between them. Hence, the theory of a link between high geodiversity and high-hazard locations was rejected. However, areas of similarity must be studied more accurately, especially in areas with the high and highest values, as they may contain some valuable geological sites that require protection.
Future Assessments
Further assessment of the Coromandel Peninsula will mostly focus on overlapping areas of geodiversity and hazard susceptibility models to identify and describe them more accurately. Due to the leisure lifestyle of the Coromandel Peninsula, with its emphasis on tourism and conservation development, these overlapping sites may become geosites for geoconservation purposes. Hence, their observation and description can be utilised in future multidisciplinary research, especially in collaboration with tourism and infrastructure planning. In conclusion, overlapping areas of geodiversity and hazard susceptibility are a potential starting point for the development of a geoconservation programme on the Coromandel Peninsula.
Author Contributions
Original Idea: KN. First Draft: VZ. Review and Editing: IG, CT, and GIS-Work: VZ. Final manuscript: VZ and IG. Funding: KN. Validation: KN, IG, and CR. Outreach: IG and CT. Geoconservation evaluation: IG and KN. Revision: VZ. All authors contributed to the article and approved the submitted version.
Conflict of Interest
The authors declare that the research was conducted in the absence of any commercial or financial relationships that could be construed as a potential conflict of interest.
Publisher’s Note
All claims expressed in this article are solely those of the authors and do not necessarily represent those of their affiliated organizations, or those of the publisher, the editors and the reviewers. Any product that may be evaluated in this article, or claim that may be made by its manufacturer, is not guaranteed or endorsed by the publisher.
References
Adams, C., Graham, I., Seward, D., Skinner, D., Adams, C., Skinner, D., et al. (1994). Geochronological and Geochemical Evolution of Late Cenozoic Volcanism in the Coromandel Peninsula, New Zealand. N. Z. J. Geol. Geophys. 37, 359–379. doi:10.1080/00288306.1994.9514626
Ahmadi, M., Derafshi, K., Mokhtari, D., Khodadadi, M., and Najafi, E. (2022). Geodiversity Assessments and Geoconservation in the Northwest of Zagros Mountain Range, Iran: Grid and Fuzzy Method Analysis. Geoheritage 14, 132. doi:10.1007/s12371-022-00769-7
Al-Hashemi, H. M. B., and Al-Amoudi, O. S. B. (2018). A Review on the Angle of Repose of Granular Materials. Powder Technol. 330, 397–417. doi:10.1016/j.powtec.2018.02.003
Attewell, P. B., and Farmer, I. W. (1976). Principles of Engineering Geology. London: Chapmanand Hall.
Bétard, F., and Peulvast, J. P. (2019). Geodiversity Hotspots: Concept, Method and Cartographic Application for Geoconservation Purposes at a Regional Scale. Environ. Manag. 63, 822–834. doi:10.1007/s00267-019-01168-5
Blatt, H., and Jones, R. L. (1975). Proportions of Exposed Igneous, Metamorphic, and Sedimentary Rocks. Geol. Soc. Am. Bull. 86, 1085–1088. doi:10.1130/0016-7606(1975)86<1085:POEIMA>2.0.CO;2
Booden, M. A., Smith, I. E., Mauk, J. L., and Black, P. M. (2012). Geochemical and Isotopic Development of the Coromandel Volcanic Zone, Northern New Zealand, Since 18 Ma. J. Volcanol. Geotherm. Res. 219, 15–32. doi:10.1016/j.jvolgeores.2012.01.005
Briggs, R., and Fulton, B. (1990). Volcanism, Structure, and Petrology of the Whiritoa-Whangamata Coastal Section, Coromandel Volcanic Zone, New Zealand: Facies Model Evidence for the Tunaiti Caldera. N. Z. J. Geol. Geophys. 33, 623–633. doi:10.1080/00288306.1990.10421380
Brilha, J., Gray, M., Pereira, D. I., and Pereira, P. (2018). Geodiversity: An Integrative Review as a Contribution to the Sustainable Management of the Whole of Nature. Environ. Sci. Policy. 86, 19–28. doi:10.1016/j.envsci.2018.05.001
Brocx, M., and Semeniuk, V. (2019). The ‘8Gs’—A Blueprint for Geoheritage, Geoconservation, Geo-Education and Geotourism. Aust. J. Earth Sci. 66, 803–821. doi:10.1080/08120099.2019.1576767
Di Baldassarre, G., Kooy, M., Kemerink, J., and Brandimarte, L. (2013). Towards Understanding the Dynamic Behaviour of Floodplains as Human-Water Systems. Hydrology Earth Syst. Sci. 17, 3235–3244. doi:10.5194/hess-17-3235-2013
Edbrooke, S. (2001). Geology of the Auckland Area: Scale 1: 250 000. Wellington, New Zealand: Institute of Geological & Nuclear Sciences.
Farsani, N. T., Coelho, C., and Costa, C. (2011). Geotourism and Geoparks as Novel Strategies for Socio-Economic Development in Rural Areas. Int. J. Tour. Res. 13, 68–81. doi:10.1002/jtr.800
GNS (2012). 1:250 000 Geological Map of New Zealand (QMAP). Avaliable at: https://www.gns.cri.nz/Home/Our-Science/Land-and-Marine-Geoscience/Regional-Geology/Geological-Maps/1-250-000-Geological-Map-of-New-Zealand-QMAP (Accessed August 31, 2021).
Gordon, J. E., and Barron, H. F. (2013). The Role of Geodiversity in Delivering Ecosystem Services and Benefits in Scotland. Scott. J. Geol. 49, 41–58. doi:10.1144/sjg2011-465
Gordon, J. E., Wignall, R. M., Brazier, V., Crofts, R., and Tormey, D. (2022). Planning for Climate Change Impacts on Geoheritage Interests in Protected and Conserved Areas. Geoheritage 14, 126. doi:10.1007/s12371-022-00753-1
Gravis, I., Németh, K., Twemlow, C., and Németh, B. (2020). The Ghosts of Old Volcanoes, a Geoheritage Trail Concept for Eastern Coromandel Peninsula, New Zealand. Geoconservation Res. 3, 40–57. doi:10.30486/gcr.2020.1902258.1020
Gray, M. (2008a). Geodiversity: Developing the Paradigm. Proc. Geologists' Assoc. 119, 287–298. doi:10.1016/s0016-7878(08)80307-0
Gray, M. (2004). Geodiversity: Valuing and Conserving Abiotic Nature. New York: John Wiley & Sons. ISBN: 0470848952, 452.
Gray, M. (2013). Geodiversity: Valuing and Conserving Abiotic Nature. 2nd ed. Chichester, United Kingdom: Wiley-Blackwell.
Gray, M. (2008b). Geoheritage 1. Geodiversity: A New Paradigm for Valuing and Conserving Geoheritage. Geosci. Can. 35, 51–59.
Guardian (2023). Cyclone Gabrielle: Child Among Four Dead in New Zealand as 1,400 Remain Missing. Avaliable at: https://www.theguardian.com/world/2023/feb/15/cyclone-gabrielle-new-zealand-storm-deaths-regions-cut-off (Accessed August 14, 2023).
Habitat (2023). Cyclone Gabrielle’s Widespread Impact Habitat for Humanity New Zealand. Avaliable at: https://habitat.org.nz/cyclone-gabrielles-widespread-impact/ (Accessed August 14, 2023).
Hayward, B. W. (2017). Out of the Ocean, Into the Fire: History in the Rocks, Fossils and Landforms of Auckland, Northland and Coromandel. Wellington, New Zealand: Geoscience Society of New Zealand.
Homer, L., and Moore, P. R. (1992). Vanishing Volcanoes: A Guide to the Landforms and Rock Formations of Coromandel Peninsula. Wellington, New Zealand: Landscape Publications.
Huggett, R. (2007). A History of the Systems Approach in Geomorphology. Géomorphologie relief, Process. Environ. 13, 145–158. doi:10.4000/geomorphologie.1031
Jasiewicz, J., and Stepinski, T. F. (2013). Geomorphons—A Pattern Recognition Approach to Classification and Mapping of Landforms. Geomorphology 182, 147–156. doi:10.1016/j.geomorph.2012.11.005
Kozłowski, S. (2004). Geodiversity. The Concept and Scope of Geodiversity. Przegląd Geol. 52, 833–837. Available at: https://www.pgi.gov.pl/images/stories/przeglad/pdf/pg_2004_08_2_22a.pdf (Accessed 15 September 2023).
Landcare Research NZ Ltd (2018). MPI Erosion Susceptibility Classification (March 2018). Avaliable at: https://catalogue.data.govt.nz/dataset/erosion-susceptibility-classification-march-2018 (Accessed October 1, 2021).
Langbein, W. B. (1964). Geometry of River Channels. J. Hydraulics Div. 90 (2), 301–312. doi:10.1061/jyceaj.0001019
Leopold, L. B., and Langbein, W. B. (1962). The Concept of Entropy in Landscape Evolution. US Government Printing Office.
LINZ Data Service (2012). LINZ NZ 8m Digital Elevation Model. Avaliable at: https://data.linz.govt.nz/layer/51768-nz-8m-digital-elevation-model-2012/ (Accessed June 29, 2022).
LINZ Data Service (2022a). LINZ NZ River Centrelines (Topo, 1:50k). Avaliable at: https://data.linz.govt.nz/layer/50327-nz-river-centrelines-topo-150k/ (Accessed August 18, 2023).
LINZ Data Service (2022b). LINZ Protected Areas. Avaliable at: https://data.linz.govt.nz/layer/53564-protected-areas/ (Accessed May 2, 2022).
LINZ (2023a). NZ Building Outlines. Avaliable At: https://data.linz.govt.nz/layer/101290-nz-building-outlines/ (Accessed September 12, 2023).
LINZ (2023b). NZ Building Outlines Lake Polygons (Topo, 1:50k). Avaliable at: https://data.linz.govt.nz/layer/50293-nz-lake-polygons-topo-150k/ (Accessed August 18, 2023).
Malengreau, B., Skinner, D., Bromley, C., and Black, P. (2000). Geophysical Characterisation of Large Silicic Volcanic Structures in the Coromandel Peninsula, New Zealand. N. Z. J. Geol. Geophys. 43, 171–186. doi:10.1080/00288306.2000.9514879
Martin, H. (2023). How Much Rain and Wind Cyclone Gabrielle Lashed Across Aotearoa. STUFF. Avaliable at: https://www.stuff.co.nz/national/300807973/how-much-rain-and-wind-cyclone-gabrielle-lashed-across-aotearoa (Accessed April 4, 2023).
McConnell, G. (2023). More Than 10,000 People Displaced in Wake of Cyclone - Where Will We House Them? STUFF. Avaliable at: https://www.stuff.co.nz/national/politics/131249421/more-than-10000-people-displaced-in-wake-of-cyclone--where-will-we-house-them (Accessed August 10, 2023).
Miller, B. A., and Juilleret, J. (2020). The Colluvium and Alluvium Problem: Historical Review and Current State of Definitions. Earth-Science Rev. 209, 103316. doi:10.1016/j.earscirev.2020.103316
Mitas, L., and Mitasova, H. (1999). “Spatial Interpolation,” in Geographical Information Systems: Principles, Techniques, Management and Applications. Editor P. Longley, M. F. Goodchild, D. J. Maguire, and D. W. Rhind (New York: Wiley). ISBN: 0471–33132–5 (Volume 1), ISBN: 0471–32182–6 (Set), 481–492.
Mortimer, N., Campbell, H., Tulloch, A., King, P., Stagpoole, V., Wood, R., et al. (2017). Zealandia: Earth’s Hidden Continent. GSA Today 27, 27–35. doi:10.1130/GSATG321A.1
Mortimer, N., Rattenbury, M., King, P., Bland, K., Barrell, D., Bache, F., et al. (2014). High-Level Stratigraphic Scheme for New Zealand Rocks. N. Z. J. Geol. Geophys. 57, 402–419. doi:10.1080/00288306.2014.946062
New Zealand Geopreservation Inventory (2019). NZGI Outstanding Natural Features. Avaliable at: http://www.geomarine.org.nz/NZGI/ (Accessed August 10, 2023).
Nicholson, K., Black, P., Hoskin, P., and Smith, I. (2004). Silicic Volcanism and Back-Arc Extension Related to Migration of the Late Cainozoic Australian–Pacific Plate Boundary. J. Volcanol. Geotherm. Res. 131, 295–306. doi:10.1016/S0377-0273(03)00382-2
Nick, W., Tim, C., Marnie, P., Adele, B., and John, K. (2023). Water Infrastructure Failures From Cyclone Gabrielle Show Low Resilience to Climate Change. Public Health Communication Centre Aotearoa. Public Health Expert Briefing (ISSN 2816-1203). Available at: https://www.phcc.org.nz/briefing/water-infrastructure-failures-cyclone-gabrielle-show-low-resilience-climate-change (Accessed September 15, 2023).
Pereira, D. I., Pereira, P., Brilha, J., and Santos, L. (2013). Geodiversity Assessment of Paraná State (Brazil): An Innovative Approach. Environ. Manag. 52, 541–552. doi:10.1007/s00267-013-0100-2
Perotti, L., Carraro, G., Giardino, M., De Luca, D. A., and Lasagna, M. (2019). Geodiversity Evaluation and Water Resources in the Sesia Val Grande UNESCO Geopark (Italy). Water 11, 2102. doi:10.3390/w11102102
Reynard, E., and Brilha, J. (2017). Geoheritage: Assessment, Protection, and Management. Amsterdam, Netherland: Elsevier. Paperback ISBN: 9780128095317, eBook ISBN: 9780128095423, 482.
RNZ (2023). Cyclone Gabrielle: Thousands Displaced, Communities Remain Cut Off and Death Toll Rises. Radio New Zealand. Avaliable at: https://www.rnz.co.nz/news/national/484349/cyclone-gabrielle-thousands-displaced-communities-remain-cut-off-and-death-toll-rises#:∼:text=17%20Feb%202023-,Cyclone%20Gabrielle%3A%20Thousands%20displaced%2C%20communities%20remain%20cut,off%20and%20death%20toll%20rises&text=The%20number%20of%20deaths%20linked,confirming%20another%20death%20near%20Napier (Accessed August 11, 2023).
Silva, J. P., Pereira, D. I., Aguiar, A. M., and Rodrigues, C. (2013). Geodiversity Assessment of the Xingu Drainage Basin. J. Maps 9, 254–262. doi:10.1080/17445647.2013.775085
Serrano, E., and Ruiz-Flaño, P. (2007). Geodiversity: A Theoretical and Applied Concept. Geogr. Helvetica 62, 140–147. doi:10.5194/gh-62-140-2007
Shapiro, M. (2023). GRASS GIS 8.3.1dev Reference Manual. Avaliable at: https://grass.osgeo.org/grass83/manuals/r.covar.html (Accessed August 8, 2023).
Smith, N., Cassidy, J., Locke, C., Mauk, J., and Christie, A. (2006). The Role of Regional-Scale Faults in Controlling a Trapdoor Caldera, Coromandel Peninsula, New Zealand. J. Volcanol. Geotherm. Res. 149, 312–328. doi:10.1016/j.jvolgeores.2005.09.005
Stepinski, T. F., and Jasiewicz, J. (2011). “Geomorphons-A New Approach to Classification of Landforms,” in Proceedings of geomorphometry 2011, Redlands, CA, September 7–9, 2011 (ESRI). 109–112.
Stets, E. G., Butman, D., McDonald, C. P., Stackpoole, S. M., DeGrandpre, M. D., and Striegl, R. G. (2017). Carbonate Buffering and Metabolic Controls on Carbon Dioxide in Rivers. Glob. Biogeochem. Cycles 31, 663–677. doi:10.1002/2016gb005578
Strahler, A. N. (1957). Quantitative Analysis of Watershed Geomorphology. Eos, Trans. Am. Geophys. Union 38, 913–920. doi:10.1029/tr038i006p00913
Trevett, C. (2023). “Cyclone Gabrielle: Temporary Housing Service Kicks in for Thousands With Homes Ruined by Cyclone in Regions,” in New Zealand Herald. Avaliable at: https://www.nzherald.co.nz/nz/politics/cyclone-gabrielle-temporary-housing-service-kicks-in-for-thousands-with-homes-ruined-by-cyclone-in-regions/W6YS43FOBFAI7DZED7XUWLG3PE/ (Accessed August 14, 2023).
Vidyadharan, A. (2023). Photos of Slip That Closed Cathedral Cove Beach Emerge. Avaliable at: https://www.stuff.co.nz/travel/news/131185025/photos-of-slip-that-closed-cathedral-cove-beach-emerge (Accessed April 4, 2023).
Wikipedia (2023). Cyclone Gabrielle. Wikipedia the Free Encyclopedia. Avaliable At: https://en.wikipedia.org/wiki/Cyclone_Gabrielle (Accessed August 9, 2023).
Zafeiropoulos, G., Drinia, H., Antonarakou, A., and Zouros, N. (2021). From Geoheritage to Geoeducation, Geoethics and Geotourism: A Critical Evaluation of the Greek Region. Geosciences 11, 381. doi:10.3390/geosciences11090381
Zakharovskyi, V., Kósik, S., Li, B., and Németh, K. (2023). Geosite Determination Based on Geodiversity Assessment Utilizing the Volcanic History of a Near-sea-Level Explosive Eruption-Dominated Volcanic Island: Tūhua/Mayor Island, New Zealand. Geol. Soc. Lond. Spec. Publ. 530, 127–140. doi:10.1144/sp530-2022-90
Zakharovskyi, V., and Németh, K. (2022a). Geomorphological Model Comparison for Geosites, Utilizing Qualitative–Quantitative Assessment of Geodiversity, Coromandel Peninsula, New Zealand. Geographies 2, 609–628. doi:10.3390/geographies2040037
Zakharovskyi, V., Nemeth, K., Gravis, I., and Twemlow, C. (2022c). Geoheritage and Geodiversity Assessment Framework for Practical Application to Geoconservation of the Coromandel Peninsula, New Zealand. Geoconservation Res. 5 (1), 59–88. doi:10.30486/GCR.2022.1935500.1097
Zakharovskyi, V., and Németh, K. (2021a). Qualitative-Quantitative Assessment of Geodiversity of Western Samoa (SW Pacific) to Identify Places of Interest for Further Geoconservation, Geoeducation, and Geotourism Development. Geographies 1, 362–380. doi:10.3390/geographies1030020
Zakharovskyi, V., and Németh, K. (2021b). Quantitative-Qualitative Method for Quick Assessment of Geodiversity. Land 10, 946. doi:10.3390/land10090946
Zakharovskyi, V., and Németh, K. (2022b). Scale Influence on Qualitative–Quantitative Geodiversity Assessments for the Geosite Recognition of Western Samoa. Geographies 2, 476–490. doi:10.3390/geographies2030029
Zhao, W., Tang, G., Ma, L., Zhao, J., Zhou, W., Tian, J., et al. (2017). Digital Elevation Model-Based Watershed Geomorphic Entropy for the Study of Landscape Evolution of a Watershed Geomorphic System in the Loess Landforms of China. Prog. Phys. Geogr. 41, 139–153. doi:10.1177/0309133316669091
Keywords: climate change, landslide, flooding, geoconservation, landuse, global changes
Citation: Zakharovskyi V, Németh K, Gravis I and Twemlow C (2023) Influences of Geohazard Susceptibility on the Geodiversity of the Coromandel Peninsula, New Zealand. Earth Sci. Syst. Soc. 3:10083. doi: 10.3389/esss.2023.10083
Received: 25 April 2023; Accepted: 27 September 2023;
Published: 18 October 2023.
Edited by:
Adolfo Quesada-Román, University of Costa Rica, Costa RicaReviewed by:
José Luis Sánchez-Cortez, National Autonomous University of Mexico, MexicoJuana Vegas, Spanish National Research Council (CSIC), Spain
Daniel Tormey, Catalyst Environmental Solutions, United States
Copyright © 2023 Zakharovskyi, Németh, Gravis and Twemlow. This is an open-access article distributed under the terms of the Creative Commons Attribution License (CC BY). The use, distribution or reproduction in other forums is permitted, provided the original author(s) and the copyright owner(s) are credited and that the original publication in this journal is cited, in accordance with accepted academic practice. No use, distribution or reproduction is permitted which does not comply with these terms.
*Correspondence: Károly Németh, a25lbWV0aDY5QGdtYWlsLmNvbQ==