 Christopher J. M. Lawley1*
 Marcus Haynes2
 Bijal Chudasama3
 Kathryn Goodenough4
 Toni Eerola3Artem Golev5Steven E. Zhang1Junhyeok Park6Eleonore Lèbre7
- 1Natural Resources Canada, Geological Survey of Canada, Ottawa, ON, Canada
- 2Geoscience Australia, Canberra, ACT, Australia
- 3Geological Survey of Finland, Espoo, Finland
- 4British Geological Survey, The Lyell Centre, Edinburgh, United Kingdom
- 5Geological Survey of Queensland, Brisbane, QLD, Australia
- 6Korea Institute of Geoscience and Mineral Resources, Daejeon, Republic of Korea
- 7Centre for Social Responsibility in Mining, Sustainable Minerals Institute, The University of Queensland, Brisbane, QLD, Australia
Disruptions to the global supply chains of critical raw materials (CRM) have the potential to delay or increase the cost of the renewable energy transition. However, for some CRM, the primary drivers of these supply chain disruptions are likely to be issues related to environmental, social, and governance (ESG) rather than geological scarcity. Herein we combine public geospatial data as mappable proxies for key ESG indicators (e.g., conservation, biodiversity, freshwater, energy, waste, land use, human development, health and safety, and governance) and a global dataset of news events to train and validate three models for predicting “conflict” events (e.g., disputes, protests, violence) that can negatively impact CRM supply chains: (1) a knowledge-driven fuzzy logic model that yields an area under the curve (AUC) for the receiver operating characteristics plot of 0.72 for the entire model; (2) a naïve Bayes model that yields an AUC of 0.81 for the test set; and (3) a deep learning model comprising stacked autoencoders and a feed-forward artificial neural network that yields an AUC of 0.91 for the test set. The high AUC of the deep learning model demonstrates that public geospatial data can accurately predict natural resources conflicts, but we show that machine learning results are biased by proxies for population density and likely underestimate the potential for conflict in remote areas. Knowledge-driven methods are the least impacted by population bias and are used to calculate an ESG rating that is then applied to a global dataset of lithium occurrences as a case study. We demonstrate that giant lithium brine deposits (i.e., >10 Mt Li2O) are restricted to regions with higher spatially situated risks relative to a subset of smaller pegmatite-hosted deposits that yield higher ESG ratings (i.e., lower risk). Our results reveal trade-offs between the sources of lithium, resource size, and spatially situated risks. We suggest that this type of geospatial ESG rating is broadly applicable to other CRM and that mapping spatially situated risks prior to mineral exploration has the potential to improve ESG outcomes and government policies that strengthen supply chains.
Introduction
The global transition to renewable energy is expected to be materially intensive (IRP, 2019; International Energy Agency, 2021; International Energy Agency, 2022). A significant proportion of the critical raw materials (CRM) required to manufacture renewable energy technologies will need to be sourced from new mineral deposits or expansions of existing mining operations because improved recycling by itself is unlikely to meet the expected surge in demand (Graedel et al., 2012; Jones et al., 2020; Lee et al., 2020; Michaux, 2021). However, geological abundance within known mineral deposits is not the primary factor limiting the supply of most CRM (Herrington, 2013; Månberger and Stenqvist, 2018; Jowitt et al., 2020; Mudd, 2021). Instead, geopolitical factors, social license, and environmental risks are some of the key challenges threatening to delay or increase the cost of new mineral projects (Erdmann and Graedel, 2011; Graedel and Reck, 2016; Mudd and Jowitt, 2018; Jowitt et al., 2020; Lèbre et al., 2020; Lèbre et al., 2022). The global supply chains of CRM are also susceptible to resource nationalism (Barandiarán, 2019), export bans (Pandyaswargo et al., 2021), and severe price fluctuations because processing is restricted to just a few places around the world (Rosenau-Tornow et al., 2009; Mancheri et al., 2019). Countries that are highly dependent on the import of CRM for their manufacturing industries are the most likely to be impacted by these potential issues. In response, governments that are reliant on imports are developing natural resource policies that on-shore, or “friend-shore” (Franks et al., 2014; Vivoda, 2023; Vivoda and Matthews, 2023), the exploration, production, and processing of CRM to diversify and secure supply chains. Any increased mineral exploration and development resulting from these policies will likely accelerate pressure on natural ecosystems, particularly in greenfield exploration settings that may have previously been deemed too remote and/or costly to operate. Shifting supply chains towards CRM frontiers may also have severe impacts for local communities and the ability for corporations to acquire the social license to operate (Lèbre et al., 2020; Hanacek et al., 2022; Owen et al., 2023). New methods are urgently needed to balance CRM development with Environmental, Social, and Governance (ESG) principles (Mudd, 2010; Herrington, 2013; Friede et al., 2015; Halbritter and Dorfleitner, 2015; van Duuren et al., 2016; Ali et al., 2017; Kotsantonis and Serafeim, 2019; Lèbre et al., 2019; Jowitt et al., 2020; Lèbre et al., 2020; Watari et al., 2021; Lawley et al., 2022a; Devenish et al., 2022; Chen et al., 2023; Edmans, 2023; Hine et al., 2023; Stewart, 2023).
The modern concept of ESG is often attributed to the “Who Cares Wins” report published by the United Nations (2004), but is in fact rooted in older corporate social responsibility principles that call for voluntary actions by businesses to extend their practices beyond mere legality (van Duuren et al., 2016; Gillan et al., 2021; Kim and Li, 2021; Arvidsson and Dumay, 2022; Bester, 2022; He et al., 2022; Uyar et al., 2022). Since 2004, ESG principles have become embedded in the world’s largest investment firms, corporate reports, and the unregulated informal economy (Gillan et al., 2021; Kim and Li, 2021; Arvidsson and Dumay, 2022; Bester, 2022; He et al., 2022). The idea behind this investment strategy is an inferential one—that sustainable businesses are associated with higher profits and lower risks over time because they provide more direct benefits to the people and places where they operate. The financial benefits to sustainable investing in the short-term are less clear and there is a growing political backlash by those who consider ESG as an encroachment on the free-market economy (Kotsantonis and Serafeim, 2019; Kim and Li, 2021; Chen et al., 2023; Edmans, 2023). Nevertheless, the trend towards ESG investing has had a major impact on the minerals sector and there is a growing interest more generally within geoscience to measure progress towards the United Nations Sustainable Development Goals (SDG; Mudd, 2010; Herrington, 2013; Ali et al., 2017; Vivoda and Kemp, 2019; Stewart, 2023; Fu et al., 2024).
Embedding ESG principles into the mining sector represents an opportunity to strengthen the global supply chains of CRM by mitigating some of the major sources of risks (van Duuren et al., 2016; Mudd and Jowitt, 2018; Valenta et al., 2019; Lèbre et al., 2020; Lèbre et al., 2022; Maybee et al., 2023; Fu et al., 2024). Improved transparency around ESG issues is also critical for impacted communities (Prno, 2013). Regulators and corporations are adapting to this change by improving ESG risk disclosure, as has recently been proposed for mineral resource reporting in Canada, Australia, South Africa, and the United Nations (Pell et al., 2021; CIM, 2023). If these changes to reporting standards are ultimately approved and sustained, corporations will be expected to embed ESG principles into their decision-making process for each mineral project and to quantify their environmental and social impact across their project portfolio. However, neither of these corporate- and project-level reporting mechanisms place ESG ratings within a regional or global context, despite the fact that most CRM projects are clustered within mineral districts operated by multiple companies (Kröger, 2016; Lèbre et al., 2019; Lèbre et al., 2020; Hanacek et al., 2022; Lèbre et al., 2022; Garcia-Zavala et al., 2023; Rossi et al., 2024). The cumulative ESG footprint of mineral districts is greater than any individual mine. The potential of impacts of individual mineral projects can also be manifested beyond the limit of mining operations and occur at a variety of spatial (and temporal) scales, ranging from local habitat destruction to the cumulative effects of increased greenhouse gas emissions that impact the globe. The complex interactions between these types of “spatially situated” risks are the focus of emerging research on “spatial finance” and “geospatial ESG” (Lèbre et al., 2019; Lèbre et al., 2020; Patterson et al., 2020; Caldecott et al., 2022; Lèbre et al., 2022; Patterson et al., 2022; Garcia-Zavala et al., 2023; Garcia-Zavala et al., 2023; Savinova et al., 2023; Rossi et al., 2024).
Previous efforts to map spatially situated risks in a CRM context have focused on the spatial overlap between ESG indicators and mineral deposits (Northey et al., 2017; Lèbre et al., 2019; Valenta et al., 2019; Lèbre et al., 2020; Sonter et al., 2020). These studies demonstrated that a significant proportion of global CRM resources (e.g., 84% of platinum resources and 70% of cobalt resources) are situated in “high-risk” regions (i.e., low ESG ratings; Lèbre et al., 2020). Accurately predicting and then managing spatially situated risks throughout the mineral development cycle (i.e., from exploration to closure) has the potential to lead to a range of positive ESG outcomes, particularly if incorporated as part of a “plan-do-check-act” cycle (Bereskie et al., 2017; Stemn et al., 2020). This type of iterative approach to land-use planning and natural resources development represents an opportunity to improve the ESG ratings of high-risk regions over time. However, previous studies have not assessed whether regions identified as “high-risk” translate to actual conflict events (e.g., disputes, protests, violence). As a result, the significance of the geospatial ESG ratings and the degree to which these previous studies fully captured the ESG context of mineral projects remains unclear. Validating geospatial ESG ratings with real conflict events is a critical step to assess the strengths and weaknesses of the different modelling methodologies. The key question then becomes can public geospatial data be used to accurately predict natural resource conflicts? Assuming this is the case, what then are the implications of a geospatial ESG rating for CRM development?
Herein we build on previous efforts to map spatially situated risks in a CRM context to address those knowledge gaps (Figure 1; Northey et al., 2017; Valenta et al., 2019; Lèbre et al., 2019; Sonter et al., 2020; Lèbre et al., 2020). Model results support government policies that seek more responsible sources of CRM, inform sustainable investing decisions, and can contribute to data-driven land-use planning at global to regional scales. First, we translate ESG principles to mappable criteria (Supplementary Table S1). Public geospatial data are then combined using the S2 discrete global grid system1 (Figures 2A, B). Three models are presented to predict the types of natural resources “conflict” (e.g., disputes, protests, and violence; Martinez-Alier, 2021; Halterman et al., 2023) that have the potential to impact CRM project budgets and timelines: (1) a knowledge-driven fuzzy logic model; (2) a simple supervised naïve Bayes model; and (3) a more advanced deep learning model based on stacked autoencoders and a feed-forward artificial neural network (Figure 1). The presence or absence of natural resources conflict events of varying severity, which were extracted from the previously published POLECAT dataset of global news stories (Halterman et al., 2023), are used as positive and negative labels, respectively, to train and validate the more advanced machine learning models (i.e., naïve Bayes and deep learning; Figure 2C; Halterman et al., 2023). Results from the knowledge-driven model are used to generate an ESG rating that is then applied to a global dataset of lithium mineral occurrences as a case study (Figures 2D–F). Lithium is used as a case study example because some of the geological sources of this CRM are geographically restricted (e.g., lithium brines are restricted to high elevations and/or low latitudes) and associated with distinct ore characteristics as well as extraction and processing routes. Although this study is focused on lithium as a text example, model results are also applicable to other CRM and natural resources more generally.
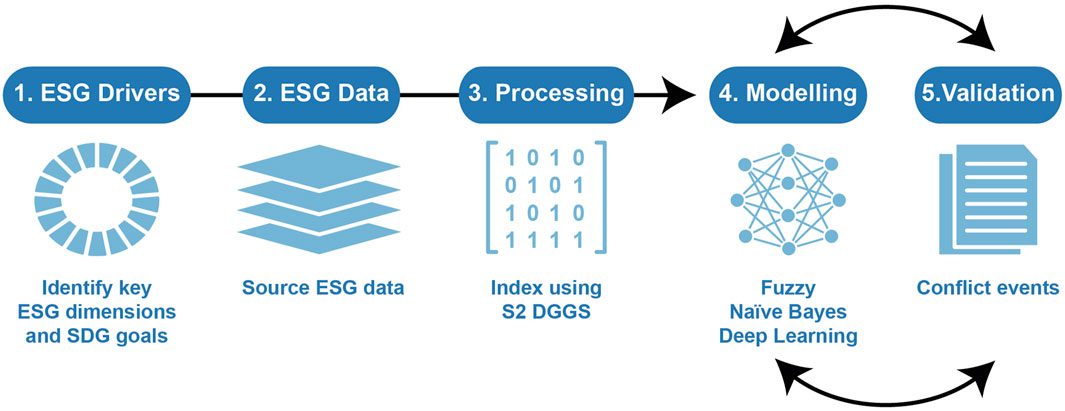
Figure 1. Spatial Environmental, Social, Governance (ESG) workflow. First, ESG dimensions are translated to mappable criteria. The source geospatial data are then spatially indexed and combined using the S2 discrete global grid systems (DGGS). Three models are presented: (1) knowledge-driven fuzzy logic model; (2) supervised naïve Bayes; and (3) deep learning model based on stacked autoencoders and a feed-forward artificial neural network. Both supervised machine learning methods used the presence or absence of conflict evidence as positive and negative labels for model training, respectively.
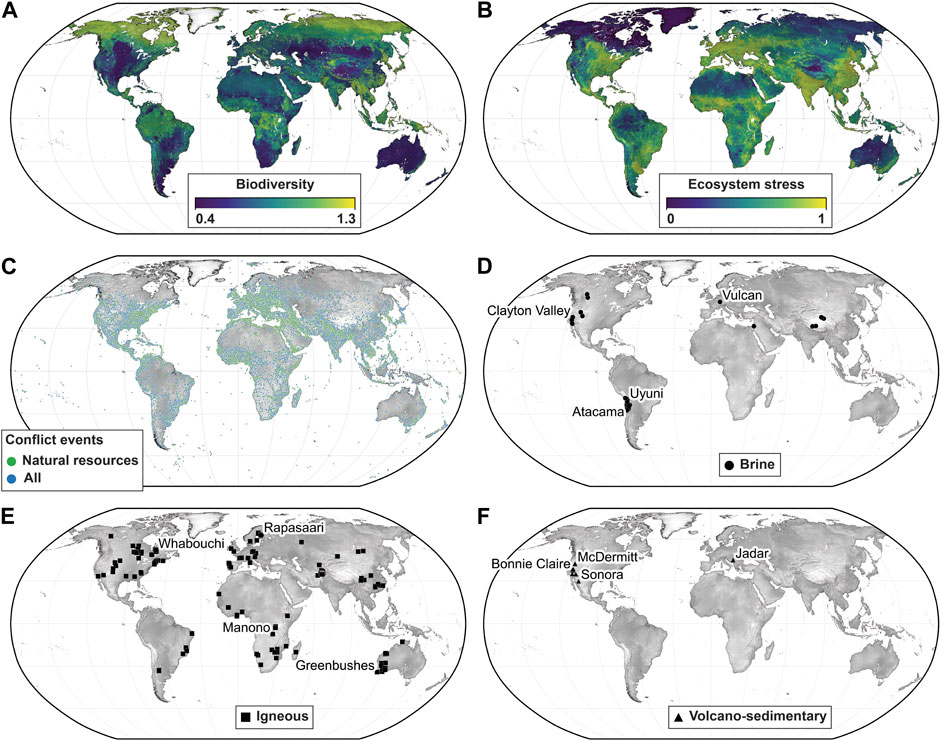
Figure 2. Global maps showing: (A) biodiversity (Newbold et al., 2016); (B) stressed ecosystems (Kennedy et al., 2019); (C) conflict events extracted from the POLECAT dataset (Halterman et al., 2023); (D) igneous-hosted lithium mineral occurrences (Labay et al., 2018; Owen J. et al., 2022); (E) brine-associated lithium mineral occurrences (Labay et al., 2018; Owen J. et al., 2022); and (F) volcano-sedimentary-associated lithium mineral occurrences (Labay et al., 2018; Owen J. et al., 2022). We interpret high biodiversity and low ecosystem stress as positive indicators for the purposes of the fuzzy logic model-based ESG rating.
Data
All data included as part of the current study are publicly available. Each data source was mapped to an ESG principle and linked to a SDG prior to modelling (Figures 1, 2; Supplementary Figures S1-S3). The complete list of data sources is presented in Supplementary Table S1.
Environmental Data
Environmental data were sourced from intergovernmental organizations, academic research, and new derivative products produced as part of the current study (Figures 2A, B; Supplementary Figure S1; Supplementary Table S1). The resolution of these data are highly variable, but most environmental indicators are derived from remote sensing with individual map pixels representing 100s of m to a few km. Individual environmental data were combined into six themes for the purposes of the knowledge-driven fuzzy logic model, including: (1) conservation; (2) biota; (3) environmental stressors (i.e., freshwater stress and air pollution); (4) carbon (i.e., above and below ground carbon storage); (5) waste management; and (6) energy (Supplementary Tables S1, S2). Data supporting the conservation theme include a new protected gap analysis, which was calculated from the percentage area overlap between the world protected areas database2 and global ecoregions (Supplementary Figures S1A, S1B; Dinerstein et al., 2017). Proxies for ecological representation of protected areas were further assessed by the percentage protection of key biodiversity areas in terrestrial, freshwater, and mountain realms as reported by the United Nations. Conservation is an important environmental theme for the SDG of “supporting life on land” (Supplementary Tables S1, S2). Data supporting the biota theme include models for biodiversity (Figure 2A; Newbold et al., 2016) and ecological intactness (Figure 2B; Kennedy et al., 2019); whereas the environmental stressors themes are mapped using the semi-quantitative measures of water stress (Hofste et al., 2019), and air quality (van Donkelaar et al., 2021), respectively. Carbon-rich landscapes represent other areas that are important for life and for mitigating future climate change (i.e., Climate Action SDG), as measured by carbon above and below ground (Supplementary Figures S1C, S1D; Spawn et al., 2020; Poggio et al., 2021; Melton et al., 2022). Missing values for the environmental data described above were imputed with an average value for each ecoregion (Supplementary Figure S1).
Poor waste management is an important source of natural resources conflicts and regions that have high potential for geohazards are particularly vulnerable to mining activities (i.e., clean water and sanitation SDG) (Owen et al., 2020). For example, up to 14% of tailings dam failures are due, at least in part to seismic hazards; whereas another 25% of tailings dam failures are caused by unusual rainfall and flooding (Rico et al., 2008). Multiple geohazards proxies were integrated as part of the current study to estimate the potential for natural phenomena to trigger mining disasters, including flooding (Dottori et al., 2016), landslides (Supplementary Figure S1E; Emberson et al., 2020), cyclones (World Bank, 2015), drought (Winsemius et al., 2018; World Bank, 2018), and seismic hazards (Supplementary Figure S1F; Shedlock et al., 2000). Heat was also considered as an environmental stressor (World Bank, 2021). Any missing data were imputed with the minimum geohazard value (i.e., low-risk). This imputation step was required because some of the source maps only included data in areas with high potential for hazards (e.g., flood zones) and all other parts of the models were assumed to have low potential for geohazards. Dam construction methods and other anthropogenic sources of mining disasters are not addressed as part of the current study.
Finally, environmental data also include multiple proxies for the capacity and/or consumption of renewable energy (International Renewable Energy Agency, 2021). Mining is energy intensive and should be based on renewable technologies wherever possible to achieve emissions targets (i.e., affordable and clean energy SDG; Azadi et al., 2020). Energy capacity (i.e., maximum newt generating capacity of existing power plants) and consumption (i.e., current use) statistics tend to be reported at the national level in gigawatts. Missing values were imputed using a continental average. Any remaining values were then imputed with the global average.
Social Data
Social data were sourced from a range of intergovernmental and academic institutions (Supplementary Table S1) and divided into five themes for the purposes of the knowledge-driven fuzzy logic model: (1) human settlements; (2) land use; (2) land rights; (3) health and safety; and (4) gender development (Supplementary Table S1, S2). The potential for CRM exploration and/or development to displace local population were mapped using proxies for population density (i.e., global human settlements; Schiavina et al., 2022), crop land (Supplementary Figure S1A; Buchhorn et al., 2020), and pasture land (i.e., cows, horses, buffalo, sheep, goats, pigs, chickens, and ducks as livestock; Supplementary Figure S2B; Gilbert et al., 2015). The spatial resolution of these data are highly variable, but are mostly derived from remote sensing with individual map pixels representing 100s of m to a few km. More than two-thirds of mining projects are located on, or near, land already occupied by Indigenous people and other communities (Owen J. R. et al., 2022). National data for gender development (e.g., proportion of women in business and government3 were averaged by country and combined with sub-national human and gender development indices wherever possible for measuring regional inequalities (Supplementary Figures S2C, S2D; Smits and Permanyer, 2019). Addressing these regional inequalities and accelerating gender equality represent two SDG. Semi-quantitative estimates for local indigenous and community land rights (Wily and Tagliarino, 2018) and indices for vulnerability to climate change (Chen et al., 2015) represent three other data sources used to map regional inequalities (Supplementary Figures S2E, S2F). Each of these semi-quantitative scores are in turn based on based on dozens of indicators (Chen et al., 2015; Wily and Tagliarino, 2018). National statistics for the total number of work fatalities and child labour statistics3 were also used as proxies for assessing health and safety. National data such as these sometimes represent the only available sources of information for measuring progress towards the SDG, but fail to account for the rural-urban divide and other regional discrepancies that can have a profound impact on natural resources conflicts. Data supporting the social dimensions of ESG are also associated with a relatively large number of missing values, which were imputed using a continental average (Supplementary Figure S2). Any remaining missing values were then imputed with the global average. These and other data limitations are discussed below.
Governance Data
Mappable criteria for governance dimensions were mostly derived from national statistics provided by the Worldwide Governance indicators4, including accountability, political stability, rule of law, government effectiveness, regulatory quality, and control of corruption (Supplementary Figures S3; Supplementary Table S1; Kaufmann et al., 2011). Each of these data sources are, in turn, based on survey responses acquired by survey institutes, think tanks, non-governmental organizations (NGOs), and corporations. Peace, justice, and strong institutions represent one SDG. The scores for each country for the last 10 years were then averaged as part of the current study to focus on the perception of governance performance over the longer term. Rapid changes in governance perceptions from year-to-year are not reflected in this analysis. Moreover, the vast majority of these surveys reflect a general perception of governance performance rather than providing information that is specific to CRM. To address that knowledge gap, perceptions of natural resource policies from the mining industry and a specific natural resource governance index were sourced from the Fraser Institute (Yunis and Aliakbari, 2021) and the Natural Resource Governance Institute5, respectively. Similar to the World Bank governance dimensions, average values are reported for each country for all availability survey years to focus on longer term trends. Missing governance data were imputed using a continental average. Any remaining missing values were then imputed with the global average.
Natural Resources Conflict Data
Decades of empirical research has shown that natural resource development has the potential to cause conflicts, including pollution, habitat destruction, armed conflict, social unrest, inequality, poverty, human rights abuses, gender-based violence, corruption, political instability, authoritarian regimes, and resource nationalism (Figure 2C; Humphreys, 2005; Cuvelier et al., 2014; Lèbre et al., 2020; Watari et al., 2021; Owen J. R. et al., 2022). The phenomenon whereby regions do not benefit from the development of their natural resources is often described as the “resource curse,” “paradox of plenty” or “Dutch Disease” (Badeeb et al., 2017; Owen et al., 2021). Predicting these types of conflict is complex because the cultural, political, environmental, economic, and geographical causes of natural resources conflict tend to be intertwined, and the perceptions of the people involved are likely to evolve over time. Gathering accurate and up-to-date data on natural resources conflicts represent a major obstacle for the type of data-driven land-use planning that is the focus of the present study. The new POLitical Event Classification, Attributes, and Types (POLECAT) dataset uses natural language processing to identify and categorize conflict from local news stories to address that knowledge gap (Halterman et al., 2023) and replaces the Integrated Crisis Early Warning System (ICEWS; O’Brien, 2010).
Herein news stories from POLECAT dataset were filtered to identify “verbal” and “material” conflict (n = 13,202,730). Data are split between 2018 (n = 4,085,387), 2019 (n = 4,390,276), 2020 (n = 2,247,876), 2021 (n = 1,117,425), and 2022 (n = 1,261,766). All conflict events were further filtered to identify news stories within the context of “natural resources” (n = 718,140). Conflict data within the context of natural resources are split between 2018 (n = 186,122), 2019 (n = 248,756), 2020 (n = 134,772), 2021 (n = 54,715), and 2022 (n = 93,755). News events with missing or imputed spatial coordinates were then removed from further analyses. The location accuracy of the remaining news events is unknown, although conflict events tend to occur in the same locations year after year. Each S2 cell was also limited to a single conflict for all study years to remove duplicate new stories (Figure 2C). After removing duplicates, the remaining natural resource conflicts (n = 5,314; Figure 2C) correspond to a range of severity, including verbal disputes, protests, physical violence, and armed conflict. In fact, what is observed in Europe, and especially Nordic countries, is that a term conflict is an overstatement and a misleading term when dealing with disagreements concerning mining (Lesser et al., 2021; Eerola, 2022). Within the conflict scale of the Environmental Justice Atlas (EJAtlas), the European events can be classified as being of low to medium intensity (Martinez-Alier, 2021). A more appropriate term for mining struggles at the level of public debate and/or minor demonstrations is “dispute” (Lesser et al., 2021; Eerola, 2022). Nevertheless, all negative news stories of varying intensity are hereafter called “conflict” for simplicity.
We also note that many of the filtered conflicts may only be partially related to natural resources and an unknown number of new stories may be completely unrelated to CRM. The POLECAT dataset does not perfectly capture ESG risks as a source constraint for CRM, but does reveal that conflicts of varying level of severity and contexts tend to be closely clustered in similar locations over 4 years (Figure 2C). The Armed Conflict Location and Event Data Project (ACLED), although not used in the current study, also identifies clusters of violent conflict events that are repeated over time. The drivers of these conflict clusters are well understood from a theoretical perspective in some cases (e.g., corruption, inequality, environmental degradation; Gleditsch, 1998; Humphreys, 2005; Colgan, 2011; Franks et al., 2014; Colgan, 2014; Cuvelier et al., 2014; Kröger, 2016; Martinez-Alier, 2021; Hanacek et al., 2022; Eerola, 2022), but have proven difficult to map aside from a small subset of geospatial data used as part of the current that directly measures violence (i.e., Worldwide Governance Indicators) (Kaufmann et al., 2011). The presence or absence of conflict events is used below as positive and negative labels, respectively, to test whether public geospatial data can be used to predict the potential for natural resources conflict within the specific context of CRM. The results are intended to support CRM decision-making but may also be applicable to natural resources development more generally (e.g., oil, gas, forestry).
Mineral Systems
Lithium was selected as the case study because demand for this CRM is expected to surge over the next decade and the most important drivers of supply chain disruptions are related to processing and ESG rather than geological scarcity (Kesler et al., 2012; Li et al., 2019; Ambrose and Kendall, 2020a; Ambrose and Kendall, 2020b). Some of the geological sources of lithium are also restricted geographically, which presents an interesting test for the geospatial ESG methodology (Figures 2D–F; discussed below). Two global mineral occurrence datasets were combined as part of the current study: (1) the global critical mineral projects dataset (n = 5,098) described by Owen J. et al. (2022). This list of critical mineral projects includes rough estimates for the total Li2O tonnage (i.e., approximate mineral resources and reserves). These tonnage estimates are not necessarily compliant with international mineral reporting standards (e.g., National Instruments, NI-43-101; Australasian Code for Reporting of Exploration Results, Mineral Resources and Ore Reserves, JORC) and are subject to large uncertainties (Owen J. et al., 2022). Herein we apply these Li2O tonnages as an approximate and semi-quantitative indicator of economic significance rather than accurate and precise measures of resource size. We also note the extreme difficulty of calculating mineral resources and reserves for lithium brines (Kesler et al., 2012); and (2) the global distribution of selected mines, deposits, and districts containing critical minerals (n = 2,121) published by the United States Geological Survey (USGS) (Labay et al., 2018). The USGS list of mineral occurrences contains location and commodity information, but does not report resources and reserves. Data were filtered by commodity to include all lithium mineral occurrences (n = 206). The filtered data comprises lithium mineral occurrences from 38 countries that range in size from 0–39 Mt of Li2O (Owen J. et al., 2022). Each lithium mineral occurrence was then re-classified into three mineral systems as part of the current study: (1) brine; (2) igneous; and (3) volcano-sedimentary (Figures 2D–F; Kesler et al., 2012; Bowell et al., 2020; Benson et al., 2023).
Brine Mineral Systems
Brine mineral systems comprise salt lakes and oilfield formation waters (Figure 2D; Risacher and Fritz, 2009; Kesler et al., 2012; Munk et al., 2016). These mineral systems represent approximately 64% of the Li2O tonnages reported by Owen J. et al. (2022). Examples include the Uyuni Salt Flat (Bolivia) and Salar de Atacama (Chile). The hot and arid climate of these regions is essential for concentrating lithium during evaporation (Munk et al., 2016). As a result, brine mineral systems are geographically restricted to hot and arid climates in mountains and/or near the equator. However, in some cases, hydrothermal fluids and pre-enriched source rocks (e.g., volcanic rocks) may be required for producing an economic lithium deposit (Hofstra et al., 2013). The source of lithium in oilfield formation waters is similarly complex and likely involves some combination of primary evaporitic brines with contributions from hydrothermal fluids interacting with pre-enriched source rocks (Dugamin et al., 2023).
Igneous mineral systems
The igneous mineral system comprises mostly pegmatite- and granite-hosted lithium occurrences. This mineral system accounts for approximately 21% of Li2O tonnages reported in Owen J. et al. (2022) and occurrences of this type are the most abundant and geographically widespread (Figure 2E). Examples of lithium pegmatites include Manono (Democratic Republic of the Congo) and Greenbushes (Australia). The host pegmatite body for these mineral systems tends to be up to a few kilometers thick but can extend laterally for 10s of km. Spodumene, petalite, elbaite, lepidolite, zinnwaldite, cookeite, and amblygonite are the primary lithium-bearing minerals in these systems. Of these, spodumene is the main ore mineral for lithium chemical production, although petalite and lepidolite are of increasing importance (Li et al., 2019). Lithium pegmatite and granite deposits typically occur in zones of past continental collision, where sedimentary rocks have melted (Bradley, 2019). The genesis of lithium pegmatites is the source of ongoing debate, with two main contrasting hypotheses: (1) lithium pegmatites are formed by extensive fractionation of a parental granite; and (2) lithium pegmatites form by direct crustal anatexis (London, 2005; Müller et al., 2018; Koopmans et al., 2023).
Volcano-Sedimentary Mineral Systems
Volcano-sedimentary mineral systems comprise clay- and other sedimentary rock-hosted occurrences (Figure 2F; Kesler et al., 2012; Bowell et al., 2020; Hofstra et al., 2013). Lithium at these deposits is structurally bound within clay minerals (e.g., lithium-bearing smectite and illite; jadarite; Stanley et al., 2007; Borst et al., 2020) and is concentrated as part of overprinting hydrothermal fluids (Benson et al., 2023). Examples of volcano-sedimentary lithium mineral systems include McDermitt (United States of America) and Sonora (Mexico). This group also includes the atypical Bonnie Claire deposit (United States of America) and the Jadar deposit (Serbia), which are hosted by lithium-bearing carbonate, halide, and borate minerals rather than clays (Stanley et al., 2007). Overall, sediment mineral systems comprise approximately 15% of global Li2O tonnages reported by Owen J. et al. (2022). The locations of all three mineral systems (Figures 2D–F) are used below as an application case study to rank lithium mineral occurrences according to their ESG rating.
Methods
Data Processing Methods
All data processing was completed in R using the “sf,” “terra,” and “tidyverse” packages (Pebesma, 2018; Wickham et al., 2019). Virtual machines were used for the most memory intensive operations, typically using the EC2 M5 instances available through Amazon Web Services6, Posit Workbench, and SageMaker (Joshi, 2020). Country and continent level information were taken from the Natural Earth dataset7. In most cases, ISO 3166-1 alpha-3 codes were used wherever possible to join national data to their geospatial polygons. Manual edits were required in a minority of cases to correct country codes that may have changed through time or to identify the most closely matching code for data sources with inconsistent formatting. Linking national data sources by country code has the potential to create local boundary artefacts for former overseas colonies and other semi-autonomous regions.
All geospatial source data were transformed to WGS84 (EPSG:4326) prior to spatial indexing using the S2 discrete global grid system1. The process of spatial indexing transforms the source map data to a common resolution using the zonal statistics function in the “exactextractr” package, which accounts for the fractional coverage between each input data and S2 cell (Baston et al., 2021). This study is based on resolution 12 of the S2 discrete global grid system, which corresponds to 26,752,643 unique cell identification numbers for terrestrial areas. The average S2 cell size at this resolution is approximately 5 km2, with an approximate edge length of 2 km.
All S2 cells were further subdivided into training and test data using spatial cross validation methods (Roberts et al., 2017). First, S2 cells containing at least natural resource conflict from the POLECAT dataset were subdivided into 60 longitude bins using a quantile function. This step ensured that each bin contained approximately the same number of natural resources conflict events. Second, the training and test sets were created by assigning each longitude bins to one of six folds. The bins were systematically staggered to make sure that each fold represents different parts of the globe (Roberts et al., 2017; Lawley et al., 2022b). Folds one to five were used for spatial cross validation during the training process. The sixth fold was not used during the training process and was created to act as a test set to evaluate model performance in “unknown” areas. Spatial cross validation methods are particularly important for more accurate assessments of machine learning performance for clustered training data (Roberts et al., 2017; Wadoux et al., 2021).
Fuzzy Logic Model Methods
Fuzzy logic is a modelling methodology that is widely used to support decision-making (Zadeh, 1965; Hüllermeier, 2005; Lisitsin et al., 2014). The method is based on the theory of fuzzy sets, which transform input values to a standard range (i.e., 0-1) using a membership function (Supplementary Figure S4; Supplementary Table S2). Each input dataset also had to be re-scaled according to whether it represents a positive or negative ESG indicator (Supplementary Tables S1, S2). High ecological representation of protected areas, high biodiversity, high ecological intactness, low potential for carbon storage, high renewable energy capacity and consumption, low potential for geohazards, high human and gender development indices, low potential for displacement of people and livelihoods, high land rights, high occupational safety standards, and high governance rankings were all interpreted as positive ESG indicators for the purposes of the fuzzy logic model (Supplementary Tables S1, S2). Two different fuzzy membership functions were then used as part of the current study: (1) linear (e.g., governance data; Supplementary Figure S2); and (2) sigmoid (e.g., environmental and social data; Supplementary Figure S4). The choice of membership function was guided by the area under the receiver operating characteristics plot (ROC-AUC) for predicting natural resources conflict. The density of all conflict events (i.e., verbal and physical events from all POLECAT categories) was also used as one of the inputs to the fuzzy model to facilitate comparison between all three models. However, unlike the more advanced machine learning methods discussed below, knowledge-driven models do not require training labels or cross validation. Fuzzy operators were then used to combine the fuzzified input values and generate a fuzzy output (Supplementary Figure S4; Supplementary Table S2). The fuzzy OR operator was used wherever required as a preliminary step to ensure that each ESG dimension is supported by a single data source. For example, the four data sources used to measure above and below ground carbon were combined into a one “carbon storage” dimension using a fuzzy OR operator so that this theme was not assigned four times the importance in the overall environmental rating (Supplementary Table S2). Fuzzified data for each ESG dimension were then combined using a fuzzy gamma operator (Supplementary Figure S4; Supplementary Table S2). The fuzzy gamma operator uses a product function to balance the increasing tendency of a simple sum operator for more accurately modelling S2 cells that contain mixed evidence (i.e., positive and negative indicators of ESG). In all cases, the fuzzy gamma value of 0.85 was selected to avoid overly penalizing negative ESG indicators. Weightings for each of the fuzzified scores were generated automatically based on the ROC-AUC for the POLECAT dataset to improve model results (Supplementary Figure S4; Supplementary Table S2). The final ESG rating is based on a fuzzy gamma operator for the combined environmental, social, and governance scores (Supplementary Figure S4; Supplementary Table S2). Higher ESG ratings (i.e., higher fuzzy scores) are interpreted below as being more favourable, and lower risk, for natural resources conflict.
Naïve Bayes Model Methods
Naïve Bayes is a simple supervised machine learning method that calculates the probability of a hypothesis (i.e., class label) given some evidence (i.e., input features; Domingos and Pazzani, 1996; Friedman et al., 1997; Wickramasinghe and Kalutarage, 2021). Predictions are based on the conditional probabilities of each feature learned during training and following Bayes’ theorem, as implemented in the H2O artificial intelligence platform8. Input data were scaled (i.e., 0-1) similar to the fuzzy model described above prior to modelling. Positive and negative training labels were derived from the re-processed POLECAT dataset based on the presence and absence of natural resources conflict events, respectively (Figure 2C; described above). Spatial cross validation was used to split data into training and test sets (described above). Multiple weightings (i.e., 10, 100, 1,000, 10,000) were used to address the extreme class imbalance between positive (n = 4,288) and negative labels (n = 22,525,819) as part of a series modelling iterations. Classification accuracy did not improve significantly after assigning the weights value to “100,” and it is this iteration of naïve Bayes models that is described below. Model performance is reported for the test set which is not used during training and provides an indication of model performance in unknown areas. Despite its simplicity (e.g., the method assumes conditional independence of the source data), naïve Bayes can yield excellent performance and works well without hyperparameter tuning and for models with large numbers of features (Friedman et al., 1997; Wickramasinghe and Kalutarage, 2021). Herein, naïve bayes is used as a simple supervised learning model to compare against the knowledge-driven fuzzy logic model (described above) and the more advanced deep learning methods (described below).
Deep Learning Model Methods
Deep learning differs from naïve Bayes and other forms of machine learning because important data features are extracted as part of the training process, reducing the need for human input (LeCun et al., 2015). Most deep learning methods are based on artificial neural networks, which can be adapted for a wide variety of unsupervised and supervised learning tasks. Feed-forward artificial neural networks, also known as multilayer perceptrons, are a basic and commonly used architecture for supervised learning tasks, whereby data flows in one direction from input to output. Layers of interconnected nodes placed between the input and output are used to create new representations of the training data. Each node’s output is regulated by an activation function, which allows the network to model non-linear relationships between the inputs. Autoencoders represent a second form of artificial neural network that can be used as part of unsupervised pre-processing to compress (i.e., encode) data into an abstract representation before attempting to recreate the original data from that representation (i.e., decode). To improve learning performance, autoencoders can also be stacked such that results from the first decoder are passed on as input to the second encoder (Supplementary Figure S5). Stacked autoencoders are able to learn more complex representations of the unlabeled input data (Gehring et al., 2013; Kannadasan et al., 2019), and are distinct from other autoencoder architectures that comprise multiple hidden layers and are trained as part of a single process.
All deep learning experiments were implemented in H2O8. First, a stack of four autoencoders comprising 32, 16, 8, and 4 nodes were used to compress the unlabeled input data to four latent variables (Supplementary Figure S5). The features learned during this unsupervised pre-training process were then joined back to the labeled data. Second, a series of feed-forward artificial neural networks were used for the supervised learning task of predicting natural resources conflict. The presence or absence of POLECAT natural resources conflict events were used as positive and negative labels, respectively, for the supervised learning stage (Figure 2C). Negative labels were down-sampled randomly without replacement to 50,000 S2 cells; whereas, positive labels were up-sampled with replacement to match the number of negative labels to address class imbalance. This simple re-sampling process produced balanced training data with a suitable size to identify the best possible combination of hyperparameters as part of a Cartesian grid search (i.e., 1-5 hidden layers; 8, 16, 32, 64, and 128 nodes; Supplementary Figure S5). The “rectifier with dropout” activation function, early stopping (i.e., five rounds using log loss as the evaluation metric), dropout (i.e., 0.2), and regularization (i.e., L1 = 0.00001; L2 = 0.00001) were kept constant to reduce the number of possible hyperparameter combinations for the Cartesian grid search and cross validation was used to further limit overfitting. In all cases, the ROC-AUC was used as the post hoc evaluation metric (Supplementary Figure S5). Two hidden layers with 16 nodes yield the highest ROC-AUC overall, although the vast majority of deep learning models yielded similar accuracy after unsupervised pre-training (±10%). The test set, which was not re-sampled and not used as part of the training process, provides an overall measure of model performance for unknown regions. The Gedeon (1997) method was used to estimate the importance of each input data source based on the magnitude contribution of each input neuron to its output neuron. In H2O, variable importance is calculated for the first two hidden layers by default. Inputs with higher variable importance provide some indication that the data has a greater impact on the model results, although these types of metrics become difficult to interpret as the number of hidden layers of a deep learning model increases.
Uncertainty Methods
Multiple methods were used to estimate the uncertainty of model results and ESG ratings. First, missing values from the source data were counted for each S2 cell (Figure 3A). Areas with a greater proportion of missing source data are interpreted as having a greater degree of uncertainty. Second, the standard deviation of the fuzzified source data (i.e., imputed and scaled) was calculated for each S2 cell and presented in Figure 3B. Areas with higher standard deviations highlight S2 cells with mixed evidence towards the ESG ratings (i.e., positive and negative indicators of ESG) and relatively high uncertainty. For example, S2 cells for countries with poor governance but well-protected ecoregions would yield relatively high standard deviations (Figure 3B). Finally, Monte Carlo-style re-sampling was used to estimate the uncertainty of the fuzzy ESG rating for each lithium mineral occurrence (Lisitsin et al., 2013; Lisitsin et al., 2014). Re-sampling was based on Gaussian distributions, which were calculated from the original data value and the standard deviation of each input data source. The simulated values for each S2 cell and variable were then fuzzified using a linear or sigmoidal membership function (i.e., scaled to a fixed range) and propagated through the fuzzy logic model (Supplementary Figure S4; Supplementary Table S2). This process was repeated 10,000 times for each lithium mineral occurrence. The standard deviation of the re-sampled data provides an uncertainty estimate for the ESG rating of each lithium mineral occurrence, taking into account uncertainty in the underlying source data.
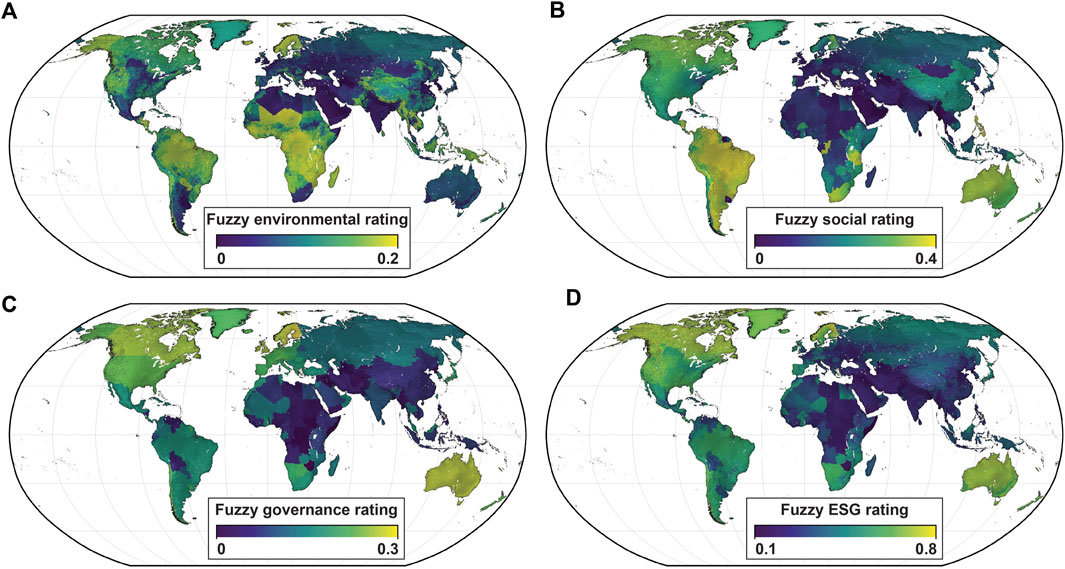
Figure 3. Global maps showing results from the knowledge-driven fuzzy logic model: (A) environmental ratings; (B) social ratings; (C) governance ratings; and (D) ESG ratings. Areas with higher ESG ratings based on the fuzzy logic model are interpreted to represent regions with lower spatially situated risks.
Results
Model Results
All model results are presented in Figures 4–10; Supplementary Tables S1-S4. Fuzzy model results range between 0.12-0.82. Higher fuzzy model results are interpreted as a higher ESG rating and lower spatially situated risks (Figure 4D). Overall, Oceania yield the highest ESG ratings (mean = 0.47; standard deviation or SD = 0.03; n = 1,833,889) followed by North America (mean = 0.45; SD = 0.03; n = 4,857,395), South America (mean = 0.41; SD = 0.02; n = 3,526,667), Europe (mean = 0.38; SD = 0.03; n = 4,388,861), Africa (mean = 0.34; SD = 0.06; n = 5,543,086), and Asia (mean 0.33; SD = 0.04; n = 6,598,894). Countries with the highest average ESG ratings include Finland (mean = 0.49), Norway (mean = 0.483), Australia (mean = 0.48), Canada (mean = 0.47), and Sweden (mean = 0.46); whereas Iraq (mean = 0.24), Zimbabwe (mean = 0.22), Syria (mean = 0.21), North Korea (mean = 0.21), and Somalia (mean = 0.16) yield the lowest ESG ratings overall (Figure 5; N.B. small islands were excluded from this ranking; Supplementary Table S3). The fuzzy results also document significant variations of ESG ratings within individual countries due, in large part, to environmental data, human settlements, land use, and sub-national human development indices (Supplementary Figures S1-S3). For example, crop and pasture land are interpreted to lower ESG ratings in areas that are otherwise well governed with good environmental protections (e.g., Canada; Figure 4D) because of the possibility of displacing people and livelihoods. The calculated ROC-AUC for the fuzzy model is 0.719 (Figure 6; Table 1). The relatively high ROC-AUC of the knowledge-driven model is due, at least in part, to using conflict density as a model input (Supplementary Table S2) and optimizing the fuzzy weights according to the natural resources conflict labels. Knowledge-driven ESG ratings are used below to expose opportunities and risks for lithium supply chains.
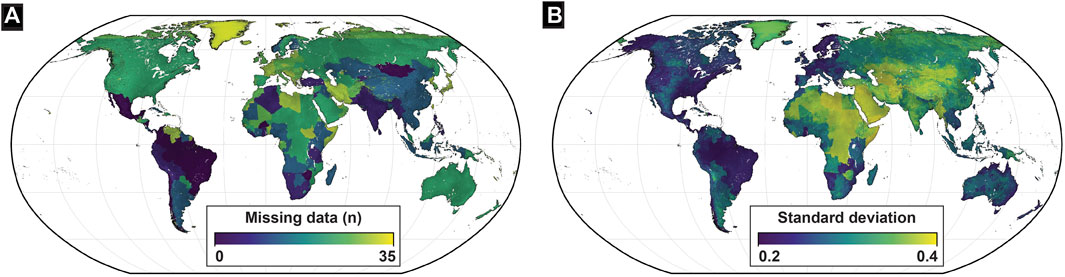
Figure 4. Global maps showing: (A) the number of missing source data per S2 cell. Fuzzy logic model-based ESG ratings for S2 cells with a greater proportion of missing source data are more uncertain; and (B) the standard deviation of the scaled source data for each S2 cell. Areas with higher standard deviations point to mixed evidence (i.e., positive and negative ESG indicators) and greater uncertainty for the calculated fuzzy model-based ESG ratings.
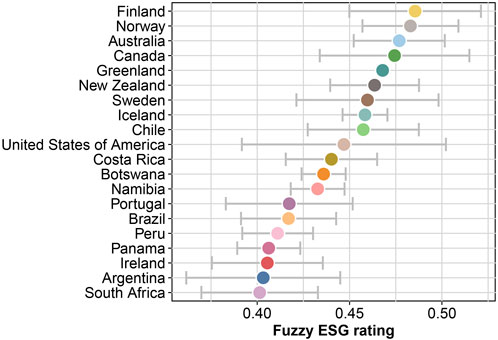
Figure 5. Top 20 countries ranked to their average fuzzy logic model-based ESG rating. Countries with higher ESG ratings are interpreted to represent regions with lower spatially saturated risks. Results have been filtered to remove small islands (i.e., 10s of km). Uncertainties are reported as two standard deviations. Countries with low uncertainties reflect relatively uniform ESG ratings and/or countries with a large proportion of missing data (e.g., Greenland).
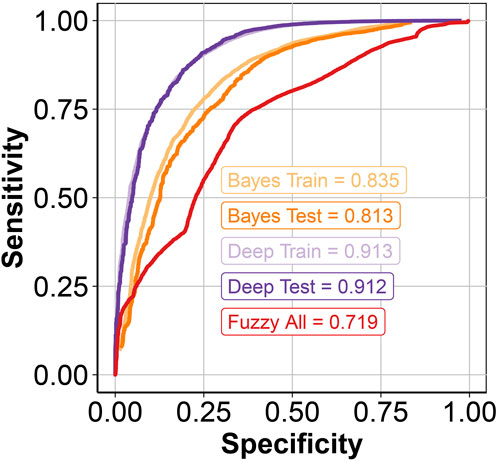
Figure 6. Receiver operating characteristics plot showing model results for the fuzzy logic, naïve Bayes, and deep learning models. Close agreement between the area under the curve (AUC) for the training and tests suggests good generalization of model results to unknown areas. Results for the fuzzy logic model are evaluated using the entire model space because natural resources conflict events were not used as labels during training.

Table 1. Model results.
The naïve Bayes algorithm yielded an ROC-AUC for the training and test of 0.835 and 0.813, respectively (Figure 6; Table 1). In contrast to the fuzzy model-based ESG rating described above, higher probabilities for natural resources conflict based on the naïve Bayes model are interpreted to reflect higher spatially situated risks and thus lower ESG ratings. The good agreement between training and test sets suggests that the naïve Bayes model can generalize well to unknown areas despite the simplicity of the modelling method. Overall, Asia (mean = 0.13; SD = 0.31) yields the great probability for natural resources conflict followed South America (mean = 0.01; SD = 0.10), North America (mean = 0.01; SD = 0.10), Europe (mean = 0.01; SD = 0.09), Africa (mean = 0.01; SD = 0.09), and Oceania (mean = <0.01; SD = 0.03). Countries with the highest potential for natural resources conflict include Bahrain (mean > 0.99), Seychelles (mean >0.99), Maldives (mean >0.99), Qatar (mean >0.99), and Barbados (mean = 0.99; N.B. Small islands were excluded from this ranking; Supplementary Table S3). Areas with the great potential for conflict over natural resources generally correspond to cities, towns, and areas with large populations. This result is expected given that these conflicts require interactions between people, but have the potential to misidentify spatially situated risks in areas with sparse populations (discussed below).
The more advanced deep learning model yields a ROC-AUC for the training and test sets of 0.913 and 0.912, respectively (Figure 6; Table 1). These results represent an 11% improvement over the ROC-AUC of the simple naïve Bayes model (Figure 6). The high AUC of the test set further suggests excellent generalization to unknown areas. Higher probabilities for natural resources conflict based on the deep learning model point to higher spatially situated risks and lower ESG ratings. Overall, Asia (mean = 0.13; SD = 0.32) yields the great probability for natural resources conflict followed by South America (mean = 0.01; SD = 0.10), North America (mean = 0.01; SD = 0.10), Europe (mean = 0.01; SD = 0.10), Africa (mean = 0.01; SD = 0.09), and Oceania (mean = <0.01; SD = 0.03). Countries with the highest potential for natural resources conflict include Bahrain (mean = 0.99), Barbados (mean = 0.97), Singapore (mean = 0.97), Jamaica (mean = 0.933), and Monaco (mean = 0.91) N.B. Small islands were excluded from this ranking; Supplementary Table S3). Country ESG rankings are remarkably similar for both machine learning models (Supplementary Table S3). Deep learning results demonstrate that human settlements, stressed ecosystems, pasture land, and crop land are the four most important predictors of natural resources conflict (Supplementary Figure S7). These results suggest that deep learning results are heavily biased towards areas of greatest population density (Figure 7) similar to the more simple naïve Bayes model described above. Variable importance further suggests that latent variables, which were automatically extracted during the autoencoders step, are more important predictors of natural resources conflict than some of the source data (Supplementary Figure S7). Automatic feature extraction is a major advantage of deep learning over other machine learning methods.
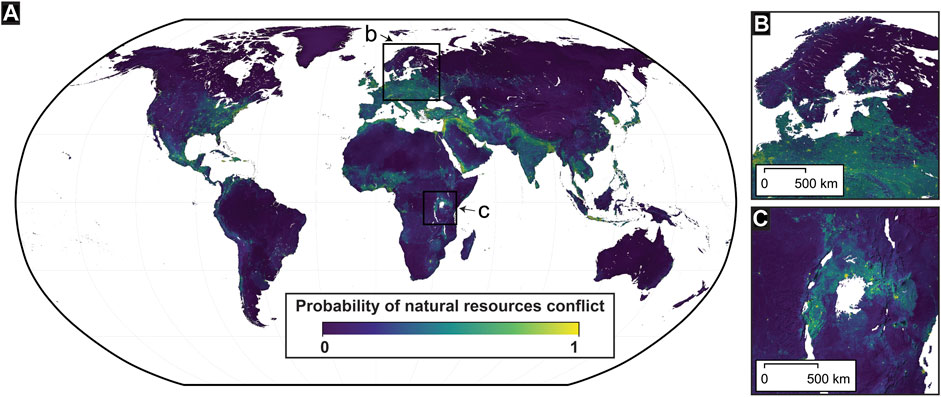
Figure 7. (A) Global map of the deep learning results showing the class probability of each S2 cell for containing a natural resources conflict. The presence or absence of POLECAT conflict events were used as positive and negative labels, respectively, for model training (see text for details). Areas with higher potential for natural resources conflict are interpreted to represent regions with higher spatially situated risks; (B) deep learning model for northern Europe, showing that areas with high potential for natural resources conflict correspond to human settlements; and (C) deep learning results for eastern Africa, showing that areas with high potential for natural resources conflict correspond to crop land, pasture land (i.e., livestock), and high geohazards.
Lithium Mineral Occurrences
The locations of lithium mineral occurrences were converted to their corresponding S2 cell before joining to the fuzzy model results (n = 206). The fuzzy model-based ESG rating and its uncertainty for each lithium mineral occurrence is presented in Figure 8 and Supplementary Table S4. Mineral occurrences with the highest ESG ratings are interpreted to be associated with lower spatially situated risks. Uncertainties are based on Monte-Carlo re-sampling of every value for each S2 cell before propagating the simulated values through the fuzzy logic model (Supplementary Figure S4; Supplementary Table S2). We interpret ESG ratings that do not overlap within uncertainty at two standard deviations as important differences (Figure 8). Overall, intrusion-hosted lithium mineral systems are the most abundant and yield the greatest range of ESG ratings (mean = 0.40; SD = 0.08; max = 0.49; min = 0.21; n = 146; Figure 8; Supplementary Table S4). These mineral systems occur all over the globe and there is high potential of finding new deposits (Figure 2D). Pegmatite-hosted lithium mineral occurrences in Canada (e.g., Whabouchi rating = 0.48) and Finland (e.g., Rapasaari rating = 0.49) yield the highest ESG ratings overall (Supplementary Table S4). Brine-hosted deposits are the second most abundant mineral system and yield the second greatest range of ESG ratings (mean = 0.42; SD = 0.04; max = 0.48; min = 0.30; n = 49; Figure 8; Supplementary Table S4). These mineral systems are geographically restricted (Figure 2E), with the highest ESG ratings located in North America (e.g., Clayton Valley rating = 0.47) and lower ESG ratings in Europe (e.g., Vulcan rating = 0.37) and South America (e.g., Atacama rating = 0.46; Uyuni rating = 0.37; Supplementary Table S4). Volcano-sedimentary lithium mineral systems are the least abundant and yield intermediate ESG ratings (mean = 0.45; SD = 0.05; max = 0.47; min = 0.31; n = 11; Supplementary Table S4). Deposits located in the United States of America (e.g., McDermitt, rating = 0.47) tend to yield higher ESG ratings than Mexico (i.e., Sonora, rating = 0.40) and Serbia (i.e., Jadar, rating = 0.31). We note that mineral licenses for the Jadar deposit were recently revoked due to environmental concerns and public opposition. The potential tradeoffs between ESG ratings and resource size are presented in Figure 9 and discussed below. Because the more advanced machine learning results are biased by population density, naïve Bayes and the deep learning results were not assessed for this case study because a large proportion of mineral occurrences are located in remote areas.
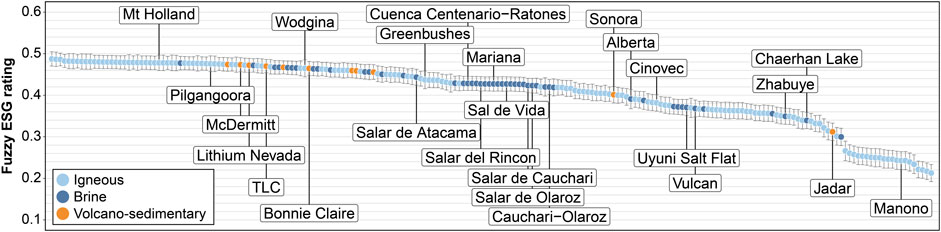
Figure 8. Monte Carlo results showing the knowledge-driven ESG rating for each lithium mineral occurrence and its uncertainties reported at two standard deviations. Mineral occurrences are colour coded to the mineral system. Labeled mineral occurrences correspond to the 25 largest Li2O tonnage estimates (Owen J. et al., 2022). The results demonstrate that the highest and lowest ESG ratings do not overlap within two standard deviations, suggesting that there are important differences in spatially situated risks for the different geological sources of lithium. Mineral occurrences with higher fuzzy logic model-based ESG ratings are interpreted as being associated with lower spatially situated risks.
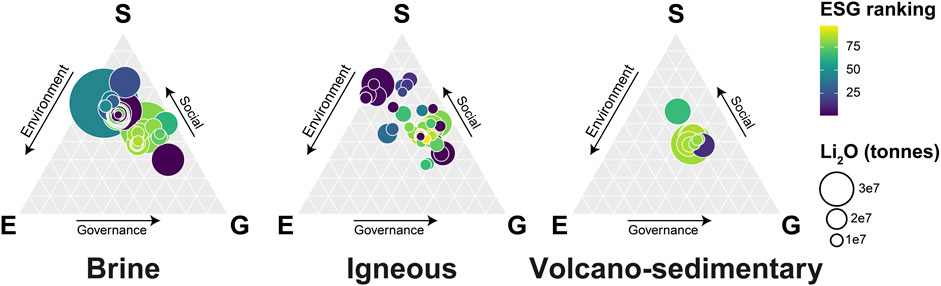
Figure 9. Ternary diagrams showing the fuzzy logic model-based ESG ratings for brine, igneous, and volcano-sedimentary lithium mineral occurrences. Colours are based on a percentile scaling of the fuzzy logic model ESG ratings to make the comparisons between mineral systems easier. Sizes are based on the total Li2O resources and reserves (Owen J. et al., 2022). Mineral occurrences with higher fuzzy logic model-based ESG ratings are interpreted as being associated with lower spatially situated risks.
Discussion
Advances in Geospatial ESG
The utility of geospatial ESG as part of pre-competitive land-use planning is three-fold: (1) it enables ESG considerations to be incorporated early in decision-making frameworks (i.e., pre-competitive) where they can influence perceptions of resource potential (Walsh et al., 2020; Lawley et al., 2022a); (2) ratings for individual projects can be placed into their regional and global contexts (Northey et al., 2017; Lèbre et al., 2019; Valenta et al., 2019; Lèbre et al., 2020; Sonter et al., 2020; Garcia-Zavala et al., 2023); and (3) geospatial ESG ratings based on public data can be used to validate corporate ESG reports and potentially guard against “greenwashing” (Moodaley and Telukdarie, 2023). The results highlight regions with high ESG ratings corresponding to well-protected ecoregions, good availability of freshwater, low risk of geohazards, access to renewable energy, low potential for the displacement of vulnerable people with weak legal rights, strong worker protections, and good governance (Figure 4; Supplementary Figures S1-S3). Some of the countries with the highest ESG ratings are prospective for a wide range of CRM. Our results highlight how public ESG data can be used to guide natural resources policies that on-shore, or friend-shore, supply chains (e.g., Mineral Security Partnership; Figure 5; Vivoda, 2023). Monte Carlo-based analysis demonstrates that the spatially situated risks identified as part of the current study reveal statistically significant differences despite uncertainties related to the underlying source data (Figure 8). The high ROC-AUC for the deep learning test set further suggests that our results are broadly applicable for predicting natural resource conflict at varying levels of severity.
Data supporting these ratings were focused on mappable criteria for the most important ESG indicators within a CRM context (Supplementary Table S1). Pollution, biodiversity, freshwater and energy consumption, waste management, health and safety, economic development, land access, and human rights are common ESG themes to virtually all CRM projects (Supplementary Table S1). Most, if not all, of these mappable ESG criteria have also been identified by international reporting standards (e.g., Global Reporting Initiative 14) and the Canadian Institute of Mining, Metallurgy, and Petroleum (CIM) as the kind of “modifying factors” that should be considered as part of the calculation and reporting of a mineral resource (CIM, 2023). Although not attempted as part of the current study, improving the linkages between geospatial ESG methodologies with project-level reporting standards (national and international) as they develop represents an important area for future research. In theory, this could allow explorationists and land-use planners to identify ESG risks prior to the discovery of a mineral deposit and then apply a “Plan-Do-Check-Act” cycle until mining closure. We expect that this type of early planning could improve social and environmental outcomes because the impact of poor decisions tends to increase from the planning stage to the operational and closure phases of a mineral project.
Results reported as part of the current study can be used to improve ESG ratings for any given jurisdiction and identify the most important spatially situated risks. Human settlement, crop land, and pasture land (i.e., livestock), and other social dimensions yield the highest variable importance for the deep learning model overall, suggesting that land access is an important catalyst for driving natural resources conflict (Supplementary Figure S6). This result is somewhat expected given that the POLECAT conflict event dataset is extracted from news stories involving people, although the locations of these news stories do not necessarily correspond to where people live (Halterman et al., 2023). Moreover, the deep learning results are able to identify nonlinear relationships between ESG dimensions that are more complex and more predictive for natural resources conflict than some of the individual source data (Supplementary Figure S7). The apparent high conflict potential in areas with human settlements underscores the importance of data-driven land use planning at the earliest possible stage of decision-making to guide government policies that seek to manage spatially situated risks and ultimately improve ESG ratings (Figure 7). Balancing the positive (e.g., decent work and economic growth) and negative aspects of mining is essential for making progress towards the SDG.
Today, public opposition presents a major financial risk to any new mineral development project and is sometimes described as not-in-my-backyard (NIMBY). This effect is even observed for well managed CRM projects with good ESG credentials. The net effect of NIMBY is that mineral exploration and development is increasingly pushed to remote CRM frontiers, or “greenfield” settings, with sparse populations (Martinez-Alier, 2021). This is reflected by the apparent low-potential for conflict in remote regions (Figure 4D, 7). Indigenous people are one of the groups most affected by this trend (Kröger, 2016; Artelle et al., 2019; Owen J. R. et al., 2022; Eerola, 2022; Hanacek et al., 2022; Owen et al., 2023). Unfortunately, rural and remote communities tend to have less resources to negotiate benefit sharing and conduct their own social impact assessments. The shifts in global supply chains towards CRM frontiers and the effects of neocolonialism are also a major source of concern for developing countries with high geological potential for CRM (Kalantzakos, 2020).
Governments that seek to strengthen the supply chains of CRM by diversifying supply through friend-shoring will likely accelerate exploration in greenfield settings because remote regions yield lower potential for conflict relative to the global average for all three models (Supplementary Table S3). Increasing mineral exploration expenditures in the Arctic represents an example of this shift and is consistent with the apparent low conflict potential in northern North America, Iceland, and Greenland predicted by the deep learning model (Figure 7; Hanacek et al., 2022). Unfortunately, Arctic ecosystems are some of the most vulnerable to climate change and there is very little data available to accurately assess the cumulative effects of any potential surge in new mineral development. Other areas with poor ESG ratings include sparsely populated islands, which yield apparently low probability for conflict based on the deep learning results despite their unique ecosystems and vulnerability to sea-level rise (N.B. deep-sea deposits were not considered as part of the current study). Knowledge-driven models are the least susceptible to these biases and likely provide the most accurate assessment of ESG ratings in remote areas (Figure 4D). The fuzzy logic model is used below to evaluate the ESG ratings of lithium mineral occurrences because greenfield settings have the greatest potential for finding new sources of CRM (Figures 8–10).
Lithium Case Study
Lithium is a CRM because: (1) lithium demand will grow by a factor of 40 between 2020 and 2040 due to increased manufacturing of electric vehicles (International Energy Agency, 2021; Michaux, 2021). Maintaining lithium supply as demand grows will likely require increased lithium production; and (2) China currently processes, beneficiates and manufacturers three-quarters of all lithium-ion batteries (International Energy Agency, 2022). However, unlike some other CRM, lithium occurs at elevated concentrations within seawater and some groundwaters and is relatively abundant in the continental crust (Kesler et al., 2012). As a result, geological scarcity is not the principal factor restricting lithium supply (Bowell et al., 2020). Instead, lithium supply chain disruptions are primarily controlled by ESG factors related to extraction and processing (Petavratzi et al., 2022). Uncertainty over the future of the Jadar deposit in Serbia due to environmental considerations represents a recent example. Life cycle analysis and previous research suggests that these ESG factors likely vary systematically according to the geological sources of lithium (Ambrose and Kendall, 2020b). Pegmatite and other igneous intrusion-hosted lithium mineral systems tend to require energy intensive mineral processing, which, in the absence of renewable energy capacity, could greatly increase carbon emissions; whereas brine processing is water intensive but requires less energy because lithium is concentrated during evaporation by solar energy. The geological sources of lithium play an important role in the interpretation of life cycle analysis.
Our new model results demonstrate that spatially situated ESG risks also vary as a function of mineral systems type. Placing these spatially situated ESG risks within the context of a mineral system complements previous commodity-focused ESG studies that did not consider the geological sources of CRM. Recognizing the geological sources of CRM is important because lithium brines are geographically restricted to mountains or areas close to the equator with hot and/or arid climates (Figures 2D–F). In contrast, igneous-related lithium deposits are the most geographically widespread and, as a result, also yield the greatest range of ESG ratings (Figure 2D; 8). However, most igneous lithium mineral systems are relatively small compared to the other potential sources of lithium (Figure 9). The pegmatite-hosted Monono deposit represents an important exception, but we demonstrate that this deposit also yields one of the lowest ESG ratings overall (Figure 8). This type of global context complements life cycle analysis by considering how the locations of raw material extraction, manufacturing, and distribution has the potential to influence environmental and social outcomes at multiple spatial scales (Ambrose and Kendall, 2020a; Ambrose and Kendall, 2020b). We note that our results are presented for mineral occurrences, which may, or may not, correspond to operating lithium mines (Supplementary Table S4). Geospatial ESG can be applied at all stages of development, even before mineral exploration starts. We suggest that predicting spatially situated risks (i.e., low ESG ratings and high potential for natural resources conflict) may also be important for unconventional sources of CRM, such as the giant volcano-sedimentary lithium minerals systems (Figure 9), where the environmental and social impacts of mining are not as well understood (e.g., acidification may be required to liberate lithium from clays; Zhao et al., 2023).
The lithium triangle in South America represents an important test site for the geospatial ESG methodology (Figure 10). Salt lakes in Chile, Bolivia, and Argentina are host to some of the largest lithium brine deposits in the world (Supplementary Table S4; Risacher and Fritz, 2009; Kesler et al., 2012; Owen J. et al., 2022). However, these high-altitude desert landscapes also represent important wildlife hotspots (e.g., flamingos and migratory shore birds) and are associated with major geohazards and extreme water scarcity (Supplementary Figure S1; Marconi et al., 2022). Social conflict has already occurred over the mining’s impact on water availability (Liu and Agusdinata, 2020; Garcia-Zavala et al., 2023). The fuzzy model demonstrates that Bolivia yields the lowest ESG ratings for the Lithium Triangle, due to the lower governance ratings (Figure 3B). However, within a global context of spatially situated risks, Bolivia, Chile, and Argentina yield intermediate ESG ratings overall (Figure 3B). This global context could be important for decision makers to prioritize investment opportunities in other jurisdictions with lower spatially situated risks or for local governments to craft natural resource policies that improve ESG credentials. At smaller spatial scales, model results highlight significant spatial overlap between the known lithium deposits and protected areas (Figure 10A) and potential hotspots for social conflict (Figure 10B). Environmental protections in Chile and Argentina boost their ESG ratings relative to Bolivia, but reduce the available search space for lithium deposits (Figure 10A). Exploration in the lithium triangle highlights how ESG dimensions are interconnected, and the challenge of balancing economic potential with ESG risks at multiple spatial scales.
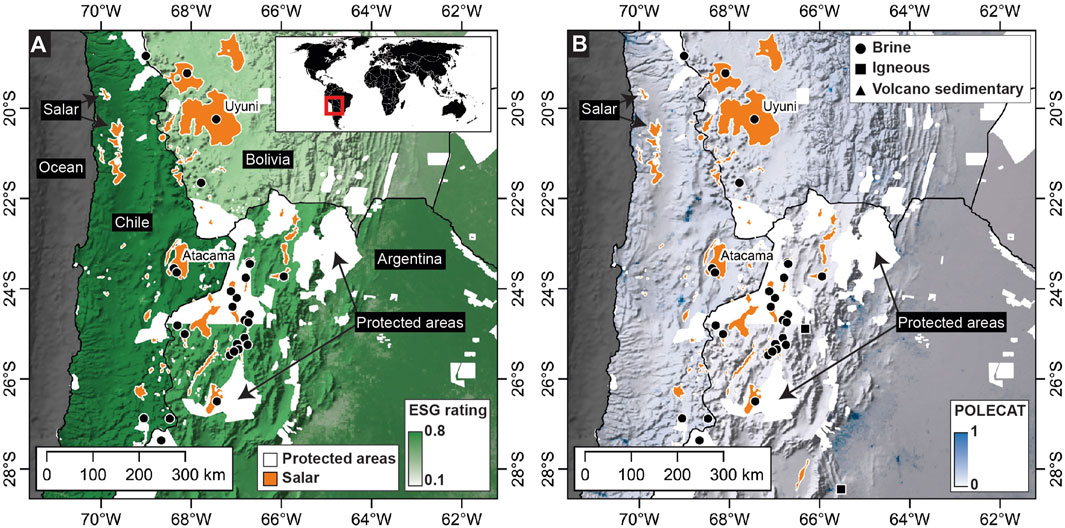
Figure 10. (A) Lithium Triangle in Bolivia, Chile, and Argentina. Colours are based on fuzzy logic model ESG rating. Areas with higher ESG ratings are interpreted to represent regions with lower spatially situated risks; (B) deep learning results for the Lithium Triangle showing the probability for natural resources conflict. Salars in orange (Mihalasky et al., 2020), lithium mineral occurrences in black (Labay et al., 2018; Mihalasky et al., 2020; Owen J. et al., 2022), and protected areas in white2 are shown for reference.
Barriers to Geospatial ESG
Demonstrating that public ESG data can be used to predict natural resources conflict is a promising result, and has implications for land-use planning, government policies, and sustainable investing. However, the efficacy of this type of data-driven land use-planning faces a number of theoretical and technical obstacles. First, a key limitation in the adoption of geospatial ESG as a methodology is the implicit need to assert risks and values. For instance, a sustainable development outcome assessed in the present paper is the safe and effective management of mine waste (see Supplementary Table S1). Our approach to assessing mine tailings ESG risks necessitates a consideration of natural hazards in isolation (Supplementary Figures S1E,S1F); whereas, a holistic understanding of risks would require the integration of natural hazards alongside infrastructure vulnerabilities and societal exposures to the impacts of tailings failures (i.e., systems thinking). The adoption of different technical solutions within projects (e.g., changes to extractive processes that minimize tailings; tailings storage facilities comprising dry stacks versus dams) will change the susceptibility to damage and exposure profile of projects. This example highlights the need for geospatial ESG metrics to be interpreted within context, and to integrate multiple sources of information as part of broader land-use planning. If pre-competitive ESG decision-making frameworks are held to be didactic, then they risk biasing results towards historic practices. This may lead to perverse outcomes if important principles are missing from the analysis as it could preclude opportunities for improvement and innovation to address existing ESG issues. Data-driven methods, such as deep learning, are particularly susceptible to embedding errors and historical biases into the results, as demonstrated above for population density. Our study focuses on public data to map the most important sources of risk to improve transparency and address those criticisms, but we also recognize that ESG values are likely to evolve over time. The temporal evolution of ESG values were not addressed as part of the current study. Moreover, ESG values have the potential to clash, an important international consideration that is already observed between cultures (Hilson et al., 2017; Mensah, 2021), and among the 17 SDG. The question of balancing economic growth (SDG-8) with the wellbeing of people (SDG-3) and the environment (SDG-14 and -15) cannot be answered by geography alone.
Second, the availability and quality of data is highly variable around the globe (Figure 3A; Supplementary Figures S1-S3). Data for some key ESG indicators is also missing (e.g., social license). High resolution data are generally available for some priority environmental dimensions (Figures 2A, B; Supplementary Figure S1), but social and governance data are generally provided as national statistics with varying reliability. Additional research is required to acquire more granular data and disaggregate national statistics wherever possible. Sub-national data are urgently needed as regional disparities within a single country and with proximity to political boundaries represent areas with high potential for natural resources conflict (Supplementary Figures S2C, S2D). Most national datasets were also collected with a different purpose than how the data is used for the present study (i.e., primary versus secondary data). The general absence of high-quality primary data means that most global studies are based on the same secondary predictors (e.g., the Worldwide Governance Indicators; Supplementary Figure S3; Kaufmann et al., 2011). Although not addressed as part of the current study, all ESG data will also vary over time. Developing computational systems that update ratings with the latest data as it becomes available is essential if geospatial ESG methodologies are adopted in the future and for near real-time monitoring of progress towards the SDG, as has recently been proposed for spatial finance (Rossi et al., 2024).
Third, ESG indicators are difficult to quantify and map even when high-quality data is available. Biodiversity could be measured as the total number of species present within an area, the number of endemic species, or genetic diversity. Protected areas (PAs) and key biodiversity areas provide some indications of such values within defined territories, although conservation decision-making is also faced with incomplete data (Supplementary Figure S1B; Lawley et al., 2022a). Social and governance indicators are similarly difficult to quantify and map. The opportunities and risks associated with each ESG indicator are also non-linear, characterized by so-called “tipping points” (Dakos et al., 2019). These abrupt changes, which are sometimes caused by far-field effects, are difficult to predict and severely complicate the interpretation of an overall ESG rating. More research is needed to identify the best indicators for each ESG dimension within the context of CRM (i.e., materiality) and model the complex, non-linear effects that characterize most natural and social phenomena. Whether machine learning could be used to identify the most important ESG indicators represents another future area of research.
Fourth, the causes of natural resources conflict are interconnected in complex ways. Untangling these risk factors for the purposes of predictive modelling is exceptionally difficult. The high standard deviation for some S2 cells highlights parts of the globe with mixed evidence (Figure 3B), which can be further evaluated by visualizing the contributions of individual data sources to the overall ESG rating (Figure 4). This type of disaggregated, layer-by-layer analysis is an essential step for unlocking the geological potential of CRM in high-risk areas and is one of the main advantages of knowledge-driven methods. In contrast, deep learning methods identify the most important features automatically as part of the training process (Supplementary Figure S7), and can be used to de-correlate input features for the purposes of prediction. However, neither of these modelling methods address the complex interactions between the ESG dimensions that drive the underlying conflict. Deep learning models are also difficult to interpret and contrast with calls for improved transparency as part of ESG risk disclosure and decision-making.
Finally, more research is needed to validate spatially situated risks with the perceptions of impacted people. Social surveys are particularly effective at capturing the multiple perspectives and epistemologies of natural resources conflicts (Petavratzi et al., 2022). Integrating these qualitative and/or semi-quantitative data with spatial models can be used as an external validation method to improve results, but is also essential for reflecting the views of marginalized people that may not be represented by the data used in this study. Strengthening social participation and basing decision-making on open data has been identified as a priority for improving ESG ratings in the lithium triangle (Figure 10; Petavratzi et al., 2022), and other regions that are prospective for CRM. We suggest that improving the accuracy and rigor of geospatial ESG methods could be one component of the broader process to make progress towards the SDG.
Conclusion
High ESG risks for some CRM projects threaten to delay or increase the cost of the renewable energy transition. The minerals industry and governments are adapting to this change by increasing ESG risk disclosure and by developing policies to diversify the production and processing of CRM to “safer” jurisdictions. Geospatial methodologies have been proposed to identify high-risk regions based on key ESG indicators. However, these previous studies did not evaluate whether regions identified as “high-risk” translate to actual natural resources conflict events. Herein we address that knowledge gap by combining public geospatial data to predict natural resources conflict. The more advanced deep learning model is the best-performing overall, but likely underestimates the potential for natural resources conflict in CRM exploration frontiers with sparse populations. For these types of settings, a knowledge-driven examination of overlapping land uses prone to conflicts may be the best way to detect their potentiality. Knowledge-driven model results reveal that giant sedimentary- and brine-hosted deposits (i.e., >10 Mt Li2O) are restricted to regions with higher spatially situated risks (i.e., low to intermediate ESG ratings) relative to a subset of smaller pegmatite-hosted mineral occurrences with the highest ESG ratings overall (i.e., lower spatially situated risks). The results point to trade-offs between the sources of lithium, resource size, and spatially situated risks. We suggest that our results are broadly applicable to other CRM and that spatially situated risks should be included as part of broader, land-use planning at the earliest possible stage of decision-making (i.e., pre-competitive) to improve ESG performance and strengthen global supply chains. It may also be valid for local and regional assessments with the incorporation of higher resolution national and sub-national datasets. Moreover, geospatial ESG results can be used by the public to validate corporate reporting, inform sustainable investments, and make progress towards the SDG.
Data Availability Statement
The datasets presented in this study can be found in online repositories. The names of the repository/repositories and accession number(s) can be found in the article/Supplementary Material.
Author Contributions
Conceptualization (all authors), Data Curation (CJML), Formal Analysis (all authors), Investigation (all authors), Methodology (CJML, MH, BC, SZ), Project Administration (CJML), Resources (CJML), Software (CJML), Supervision (CJML), Validation (all authors), Verification (all authors), Visualization (CJML), Writing – Original Draft Preparation (all authors), Writing – Reviewing and Editing (all authors). All authors contributed to the article and approved the submitted version.
Funding
The author(s) declare that financial support was received for the research, authorship, and/or publication of this article. This research was completed as part of the Critical Minerals Geoscience and Data Initiative.
Conflict of Interest
The authors declare that the research was conducted in the absence of any commercial or financial relationships that could be construed as a potential conflict of interest.
Publisher’s Note
All claims expressed in this article are solely those of the authors and do not necessarily represent those of their affiliated organizations, or those of the publisher, the editors and the reviewers. Any product that may be evaluated in this article, or claim that may be made by its manufacturer, is not guaranteed or endorsed by the publisher.
Acknowledgments
Funding for this work was provided by the Critical Minerals Geoscience and Data (CMGD) Initiative. Part of this study was supported by the Basic Research Program (grant number GP2020-007) of the Korea Institute of Geoscience and Mineral Resources (KIGAM). MH publishes with the permission of the CEO of Geoscience Australia. The authors would like to thank Matthew Greenwood, Bronwen Wang, Joanna Torppa, Mari Kivinen, Karol Czarnota, Andrew Hughes, Paul Lusty, and Geneviève Marquis for conversations that improved this manuscript. Special thank you to Renato Cumani, Sarlae McAlpine, Karol Czarnota, Matthew Cracknell and Matthew Grimshaw for comments that improved this manuscript.
Supplementary Material
The Supplementary Material for this article can be found online at: https://www.escubed.org/articles/10.3389/esss.2024.10109/full#supplementary-material
SUPPLEMENTARY FIGURE S1 | Data supporting the environmental dimension, including: (A) ecoregions; (B) protected areas; (C) below ground carbon; (D) above ground carbon; (E) landslide hazards; and (F) seismic hazards. Areas with high carbon and high potential for geohazards were considered negative ESG indicators for the purposes of the fuzzy logic model.
SUPPLEMENTARY FIGURE S2 | Data supporting the social dimension, including: (A) crop land (Buchhorn et al., 2020); (B) livestock (Gilbert et al., 2015); (C) sub-national human development indices (Smits and Permanyer, 2019); (D) sub-national gender development indices (Smits and Permanyer, 2019); (E) Indigenous rights (Wily and Tagliarino, 2018); and (F) climate vulnerability (Chen et al., 2015). Areas with crop land, livestock, and high climate vulnerability were considered as negative ESG indicators for the purposes of the fuzzy logic model; whereas, high human and gender development indices and high Indigenous rights were considered positive ESG indicators.
SUPPLEMENTARY FIGURE S3 | Data supporting the governance dimension based on the Worldwide Governance Indicators (Kaufmann et al., 2011). All of these indicators were considered as positive ESG indicators.
SUPPLEMENTARY FIGURE S4 | Schematic diagram showing the knowledge-driven fuzzy logic modelling workflow. Source data were spatially indexed to the S2 discrete global grid system before scaling (i.e., positive ESG indicators correspond to higher values) and applying a fuzzy membership function (i.e., sigmoid or linear). Fuzzified scores are combined using a fuzzy OR operator for environmental and social themes supported by more than one dataset (e.g., multiple datasets map carbon storage). Each theme supporting each ESG dimension was then combined using a fuzzy gamma operator. The fuzzy gamma operator was also used to combine environmental, social, and governance ratings to calculate an overall ESG rating. Natural resource conflicts were used to guide the weightings of the fuzzified scores but are not required for model training.
SUPPLEMENTARY FIGURE S5 | Schematic diagram showing the deep learning modelling workflow. First, all source data were used as input for an autoencoders-based artificial neural network as a form of unsupervised pre-processing. Outputs from the first autoencoder are passed on as input for the second autoencoder and this process repeats itself for the third autoencoder. Second, deep learning features were then joined back to the source data for the supervised machine learning task. A grid search was used to find the best possible combination of hyperparameters for the feed-forward artificial neural network.
SUPPLEMENTARY FIGURE S6 | Unsupervised pre-training using stacked autoencoders generated four latent variables (a-d). Each of these new features were joined back to the original data to train an artificial neural network based on the locations of natural resources conflict events.
SUPPLEMENTARY FIGURE S7 | Variable importance plot for the deep learning model based on the method described by Gedeon (1997) and implemented in H2O8. The ESG dimensions with higher variable importance are generally considered to have had a greater impact on the deep learning results.
Footnotes
3https://unstats.un.org/sdgs/dataportal
4https://info.worldbank.org/governance/wgi
5https://resourcegovernanceindex.org
7https://www.naturalearthdata.com/
References
Ali, S. H., Giurco, D., Arndt, N., Nickless, E., Brown, G., Demetriades, A., et al. (2017). Mineral Supply for Sustainable Development Requires Resource Governance. Nature 543 (7645), 367–372. doi:10.1038/nature21359
Ambrose, H., and Kendall, A. (2020a). Understanding the Future of Lithium: Part 1, Resource Model. J. Industrial Ecol. 24 (1), 80–89. doi:10.1111/jiec.12949
Ambrose, H., and Kendall, A. (2020b). Understanding the Future of Lithium: Part 2, Temporally and Spatially Resolved Life-Cycle Assessment Modeling. J. Industrial Ecol. 24 (1), 90–100. doi:10.1111/jiec.12942
Artelle, K. A., Zurba, M., Bhattacharyya, J., Chan, D. E., Brown, K., Housty, J., et al. (2019). Supporting Resurgent Indigenous-Led Governance: A Nascent Mechanism for Just and Effective Conservation. Biol. Conserv. 240, 108284. doi:10.1016/j.biocon.2019.108284
Arvidsson, S., and Dumay, J. (2022). Corporate ESG Reporting Quantity, Quality and Performance: Where to Now for Environmental Policy and Practice? Bus. Strategy Environ. 31 (3), 1091–1110. doi:10.1002/bse.2937
Azadi, M., Northey, S. A., Ali, S. H., and Edraki, M. (2020). Transparency on Greenhouse Gas Emissions From Mining to Enable Climate Change Mitigation. Nat. Geosci. 13 (2), 100–104. doi:10.1038/s41561-020-0531-3
Badeeb, R. A., Lean, H. H., and Clark, J. (2017). The Evolution of the Natural Resource Curse Thesis: A Critical Literature Survey. Resour. Policy 51, 123–134. doi:10.1016/j.resourpol.2016.10.015
Barandiarán, J. (2019). Lithium and Development Imaginaries in Chile, Argentina and Bolivia. World Dev. 113, 381–391. doi:10.1016/j.worlddev.2018.09.019
Baston, D., Isciences, L. L. C., and Baston, M. D. (2021). Package ‘Exactextractr’. Available at: https://github.com/isciences/exactextractr.
Benson, T. R., Coble, M. A., and Dilles, J. H. (2023). Hydrothermal Enrichment of Lithium in Intracaldera Illite-Bearing Claystones. Sci. Adv. 9 (35), eadh8183. doi:10.1126/sciadv.adh8183
Bereskie, T., Rodriguez, M. J., and Sadiq, R. (2017). Drinking Water Management and Governance in Canada: An Innovative Plan-Do-Check-Act (PDCA) Framework for a Safe Drinking Water Supply. Environ. Manag. 60 (2), 243–262. doi:10.1007/s00267-017-0873-9
Bester, V. (2022). A Corporate Social Responsibility Conceptual Framework to Address Artisanal Gold Mining in South Africa. Resour. Policy 79, 103030. doi:10.1016/j.resourpol.2022.103030
Borst, A. M., Smith, M. P., Finch, A. A., Estrade, G., Villanova-de-Benavent, C., Nason, P., et al. (2020). Adsorption of Rare Earth Elements in Regolith-Hosted Clay Deposits. Nat. Commun. 11 (1), 4386. doi:10.1038/s41467-020-17801-5
Bowell, R. J., Lagos, L., de los Hoyos, C. R., and Declercq, J. (2020). Classification and Characteristics of Natural Lithium Resources. Elements 16 (4), 259–264. doi:10.2138/gselements.16.4.259
Bradley, D. C. (2019). Tectonic and Paleoclimatic Controls of Lithium-Cesium-Tantalum (LCT) Pegmatite Genesis, Exhumation, and Preservation In the Appalachians. Can. Mineral. 57 (5), 715–717. doi:10.3749/canmin.ab00002
Buchhorn, M., Smets, B., Bertels, L., De Roo, B., Lesiv, M., Tsendbazar, N., et al. (2020). Copernicus Global Land Service: Land Cover 100m: Collection 3: Epoch 2019: Globe 2020.
Caldecott, B., McCarten, M., Christiaen, C., and Hickey, C. (2022). Spatial Finance: Practical and Theoretical Contributions to Financial Analysis. J. Sustain. Finance Invest. 0 (0), 1–17. doi:10.1080/20430795.2022.2153007
Chen, C., Noble, I., Hellmann, J., Coffee, J., Murillo, M., and Chawla, N. (2015). Global Adaptation Country Index. Notre Dame, IN: University of Notre Dame, 1–46.
Chen, S., Song, Y., and Gao, P. (2023). Environmental, Social, and Governance (ESG) Performance and Financial Outcomes: Analyzing the Impact of ESG on Financial Performance. J. Environ. Manag. 345, 118829. doi:10.1016/j.jenvman.2023.118829
CIM (2023). CIM Environmental, Social and Governance Guidelines for Mineral Resource and Mineral Reserve Estimation. Montreal, QC: Canadian Institute of Mining, Metallurgy, and Petroleum, 64.
Colgan, J. (2011). Oil and Resource-Backed Aggression. Energy Policy 39 (3), 1669–1676. doi:10.1016/j.enpol.2010.12.042
Colgan, J. D. (2014). Oil, Domestic Politics, and International Conflict. Energy Res. Soc. Sci. 1, 198–205. doi:10.1016/j.erss.2014.03.005
Cuvelier, J., Vlassenroot, K., and Olin, N. (2014). Resources, Conflict and Governance: A Critical Review. Extr. Industries Soc. 1 (2), 340–350. doi:10.1016/j.exis.2014.07.006
Dakos, V., Matthews, B., Hendry, A. P., Levine, J., Loeuille, N., Norberg, J., et al. (2019). Ecosystem Tipping Points in an Evolving World. Nat. Ecol. Evol. 3 (3), 355–362. doi:10.1038/s41559-019-0797-2
Devenish, K., Desbureaux, S., Willcock, S., and Jones, J. P. G. (2022). On Track to Achieve No Net Loss of Forest at Madagascar’s Biggest Mine. Nat. Sustain. 5 (6), 498–508. doi:10.1038/s41893-022-00850-7
Dinerstein, E., Olson, D., Joshi, A., Vynne, C., Burgess, N. D., Wikramanayake, E., et al. (2017). An Ecoregion-Based Approach to Protecting Half the Terrestrial Realm. BioScience 67 (6), 534–545. doi:10.1093/biosci/bix014
Domingos, P., and Pazzani, M. (1996). “Beyond Independence: Conditions for the Optimality of the Simple Bayesian Classifier,” in Proc. 13th Intl. Conf. Machine Learning, 105–112.
Dottori, F., Salamon, P., Bianchi, A., Alfieri, L., Hirpa, F. A., and Feyen, L. (2016). Development and Evaluation of a Framework for Global Flood Hazard Mapping. Adv. Water Resour. 94, 87–102. doi:10.1016/j.advwatres.2016.05.002
Dugamin, E. J. M., Cathelineau, M., Boiron, M.-C., Richard, A., and Despinois, F. (2023). Lithium Enrichment Processes in Sedimentary Formation Waters. Chem. Geol. 635, 121626. doi:10.1016/j.chemgeo.2023.121626
Eerola, T. (2022). Corporate Conduct, Commodity and Place: Ongoing Mining and Mineral Exploration Disputes in Finland and Their Implications for the Social License to Operate. Resour. Policy 76, 102568. doi:10.1016/j.resourpol.2022.102568
Emberson, R., Kirschbaum, D., and Stanley, T. (2020). New Global Characterisation of Landslide Exposure. Nat. Hazards Earth Syst. Sci. 20 (12), 3413–3424. doi:10.5194/nhess-20-3413-2020
Erdmann, L., and Graedel, T. E. (2011). Criticality of Non-Fuel Minerals: A Review of Major Approaches and Analyses. Environ. Sci. Technol. 45 (18), 7620–7630. doi:10.1021/es200563g
Franks, D. M., Davis, R., Bebbington, A. J., Ali, S. H., Kemp, D., and Scurrah, M. (2014). Conflict Translates Environmental and Social Risk Into Business Costs. Proc. Natl. Acad. Sci. 111 (21), 7576–7581. doi:10.1073/pnas.1405135111
Friede, G., Busch, T., and Bassen, A. (2015). ESG and Financial Performance: Aggregated Evidence From More Than 2000 Empirical Studies. J. Sustain. Finance Invest. 5 (4), 210–233. doi:10.1080/20430795.2015.1118917
Friedman, N., Geiger, D., and Goldszmidt, M. (1997). Bayesian Network Classifiers. Mach. Learn. 29 (2), 131–163. doi:10.1023/a:1007465528199
Fu, C., Yu, C., Guo, M., and Zhang, L. (2024). ESG Rating and Financial Risk of Mining Industry Companies. Resour. Policy 88, 104308. doi:10.1016/j.resourpol.2023.104308
Garcia-Zavala, C., Ordens, C. M., Pagliero, L., Lèbre, É., Aitken, D., and Stringer, M. (2023). An Approach for Prioritising Environmental, Social and Governance (ESG) Water-Related Risks for the Mining Industry: The Case of Chile. Extr. Industries Soc. 14, 101259. doi:10.1016/j.exis.2023.101259
Gedeon, T. D. (1997). Data Mining of Inputs: Analysing Magnitude and Functional Measures. Int. J. Neural Syst. 08 (02), 209–218. doi:10.1142/s0129065797000227
Gehring, J., Miao, Y., Metze, F., and Waibel, A. (2013). “Extracting Deep Bottleneck Features Using Stacked Auto-Encoders,” in 2013 IEEE International Conference on Acoustics, Speech and Signal Processing (IEEE), 3377–3381.
Gilbert, M., Cinardi, G., Da Ra, D., Wint, W., Wisser, D., and Robinson, T. (2015). Gridded Livestock of the World (GLW): Food and Agriculture Organization of the United Nations GLW 4: Gridded Livestock Density (Global - 2015 - 10 Km).
Gillan, S. L., Koch, A., and Starks, L. T. (2021). Firms and Social Responsibility: A Review of ESG and CSR Research in Corporate Finance. J. Corp. Finance 66, 101889. doi:10.1016/j.jcorpfin.2021.101889
Gleditsch, N. P. (1998). Armed Conflict and the Environment: A Critique of the Literature. J. Peace Res. 35 (3), 381–400. doi:10.1177/0022343398035003007
Graedel, T. E., Barr, R., Chandler, C., Chase, T., Choi, J., Christoffersen, L., et al. (2012). Methodology of Metal Criticality Determination. Environ. Sci. Technol. 46 (2), 1063–1070. doi:10.1021/es203534z
Graedel, T. E., and Reck, B. K. (2016). Six Years of Criticality Assessments: What Have We Learned So Far? J. Industrial Ecol. 20 (4), 692–699. doi:10.1111/jiec.12305
Halbritter, G., and Dorfleitner, G. (2015). The Wages of Social Responsibility — Where Are They? A Critical Review of ESG Investing. Rev. Financial Econ. 26, 25–35. doi:10.1016/j.rfe.2015.03.004
Halterman, A., Bagozzi, B., Beger, A., Schrodt, P., and Scraborough, G. (2023). PLOVER and POLECAT: A New Political Event Ontology and Dataset.
Hanacek, K., Kröger, M., Scheidel, A., Rojas, F., and Martinez-Alier, J. (2022). On Thin Ice – The Arctic Commodity Extraction Frontier and Environmental Conflicts. Ecol. Econ. 191, 107247. doi:10.1016/j.ecolecon.2021.107247
He, F., Qin, S., Liu, Y., and Wu (George), J. (2022). CSR and Idiosyncratic Risk: Evidence From ESG Information Disclosure. Finance Res. Lett. 49, 102936. doi:10.1016/j.frl.2022.102936
Herrington, R. (2013). Road Map to Mineral Supply. Nat. Geosci. 6 (11), 892–894. doi:10.1038/ngeo1947
Hilson, G., Hilson, A., Maconachie, R., McQuilken, J., and Goumandakoye, H. (2017). Artisanal and Small-Scale Mining (ASM) in Sub-Saharan Africa: Re-Conceptualizing Formalization and ‘illegal’ Activity. Geoforum 83, 80–90. doi:10.1016/j.geoforum.2017.05.004
Hine, A., Gibson, C., and Mayes, R. (2023). Critical Minerals: Rethinking Extractivism? Aust. Geogr. 54 (3), 233–250. doi:10.1080/00049182.2023.2210733
Hofste, R. W., Kuzma, S., Walker, S., Sutanudjaja, E. H., Bierkins, M. F., Kuijper, M. J., et al. (2019). Aqueduct 3.0: Updated Decision-Relevant Global Water Risk Indicators. Washington, DC: World Resources Institute, 1–53.
Hofstra, A. H., Todorov, T. I., Mercer, C. N., Adams, D. T., and Marsh, E. E. (2013). Silicate Melt Inclusion Evidence for Extreme Pre-Eruptive Enrichment and Post-Eruptive Depletion of Lithium in Silicic Volcanic Rocks of the Western United States: Implications for the Origin of Lithium-Rich Brines. Econ. Geol. 108 (7), 1691–1701. doi:10.2113/econgeo.108.7.1691
Hüllermeier, E. (2005). Fuzzy Methods in Machine Learning and Data Mining: Status and Prospects. Fuzzy Sets Syst. 156 (3), 387–406. doi:10.1016/j.fss.2005.05.036
Humphreys, M. (2005). Natural Resources, Conflict, and Conflict Resolution: Uncovering the Mechanisms. J. Confl. Resolut. 49 (4), 508–537. doi:10.1177/0022002705277545
International Energy Agency (2021). The Role of Critical Minerals in Clean Energy Transitions. Paris, France: International Energy Agency, 287.
International Energy Agency (2022). Global EV Outlook 2022: Global EV Outlook 2022. Paris, France: International Energy Agency, 221.
International Renewable Energy Agency (2021). Renewable Energy Statistics, IRENASTAT. Available at: https://www.irena.org/.
IRP (2019). Global Resources Outlook 2019: Natural Resources for the Future We Want: United Nations Environment Programme. Nairobi, Kenya: International Resource Panel, United Nations Environment Programme, 162.
Jones, B., Elliott, R. J. R., and Nguyen-Tien, V. (2020). The EV Revolution: The Road Ahead for Critical Raw Materials Demand. Appl. Energy 280, 115072. doi:10.1016/j.apenergy.2020.115072
Joshi, A. V. (2020). “Amazon’s Machine Learning Toolkit: Sagemaker,” in Machine Learning and Artificial Intelligence (Springer), 233–243.
Jowitt, S. M., Mudd, G. M., and Thompson, J. F. H. (2020). Future Availability of Non-Renewable Metal Resources and the Influence of Environmental, Social, and Governance Conflicts on Metal Production. Commun. Earth Environ. 1 (1), 13–18. doi:10.1038/s43247-020-0011-0
Kalantzakos, S. (2020). The Race for Critical Minerals in an Era of Geopolitical Realignments. Int. Spectator 55 (3), 1–16. doi:10.1080/03932729.2020.1786926
Kannadasan, K., Edla, D. R., and Kuppili, V. (2019). Type 2 Diabetes Data Classification Using Stacked Autoencoders in Deep Neural Networks. Clin. Epidemiol. Glob. Health 7 (4), 530–535. doi:10.1016/j.cegh.2018.12.004
Kaufmann, D., Kraay, A., and Mastruzzi, M. (2011). The Worldwide Governance Indicators: Methodology and Analytical Issues. Hague J. Rule Law 3 (2), 220–246. doi:10.1017/s1876404511200046
Kennedy, C. M., Oakleaf, J. R., Theobald, D. M., Baruch-Mordo, S., and Kiesecker, J. (2019). Managing the Middle: A Shift in Conservation Priorities Based on the Global Human Modification Gradient. Glob. Change Biol. 25 (3), 811–826. doi:10.1111/gcb.14549
Kesler, S. E., Gruber, P. W., Medina, P. A., Keoleian, G. A., Everson, M. P., and Wallington, T. J. (2012). Global Lithium Resources: Relative Importance of Pegmatite, Brine and Other Deposits. Ore Geol. Rev. 48, 55–69. doi:10.1016/j.oregeorev.2012.05.006
Kim, S., and Li(Frank), Z. (2021). Understanding the Impact of ESG Practices in Corporate Finance. Sustainability 13 (7), 3746. doi:10.3390/su13073746
Koopmans, L., Martins, T., Linnen, R., Gardiner, N. J., Breasley, C. M., Palin, R. M., et al. (2023). The Formation of Lithium-Rich Pegmatites Through Multi-Stage Melting. Geology 52 (1), 7–11. doi:10.1130/g51633.1
Kotsantonis, S., and Serafeim, G. (2019). Four Things No One Will Tell You About ESG Data. J. Appl. Corp. Finance 31 (2), 50–58. doi:10.1111/jacf.12346
Kröger, M. (2016). Spatial Causalities in Resource Rushes: Notes From the Finnish Mining Boom. J. Agrar. Change 16 (4), 543–570. doi:10.1111/joac.12113
Labay, K., Burger, M. H., Bellora, J. D., Schulz, K. J., DeYoung, J. H., Seal, R. R., et al. (2018). Global Distribution of Selected Mines, Deposits, and Districts of Critical Minerals. Anchorage, Alaska: United States Geological Survey, 777.
Lawley, C. J. M., McCafferty, A. E., Graham, G. E., Huston, D. L., Kelley, K. D., Czarnota, K., et al. (2022b). Data–Driven Prospectivity Modelling of Sediment–Hosted Zn–Pb Mineral Systems and Their Critical Raw Materials. Ore Geol. Rev. 141, 104635. doi:10.1016/j.oregeorev.2021.104635
Lawley, C. J. M., Mitchell, M. G. E., Stralberg, D., Schuster, R., McIntire, E., and Bennett, J. R. (2022a). Mapping Canada’s Green Economic Pathways for Battery Minerals: Balancing Prospectivity Modelling With Conservation and Biodiversity Values. Earth Sci. Syst. Soc. 2, 10064. doi:10.3389/esss.2022.10064
Lèbre, É., Owen, J. R., Corder, G. D., Kemp, D., Stringer, M., and Valenta, R. K. (2019). Source Risks as Constraints to Future Metal Supply. Environ. Sci. Technol. 53 (18), 10571–10579. doi:10.1021/acs.est.9b02808
Lèbre, É., Owen, J. R., Kemp, D., and Valenta, R. K. (2022). Complex Orebodies and Future Global Metal Supply: An Introduction. Resour. Policy 77, 102696. doi:10.1016/j.resourpol.2022.102696
Lèbre, É., Stringer, M., Svobodova, K., Owen, J. R., Kemp, D., Côte, C., et al. (2020). The Social and Environmental Complexities of Extracting Energy Transition Metals. Nat. Commun. 11 (1), 4823. doi:10.1038/s41467-020-18661-9
LeCun, Y., Bengio, Y., and Hinton, G. (2015). Deep Learning. Nature 521 (7553), 436–444. doi:10.1038/nature14539
Lee, J., Bazilian, M., Sovacool, B., Hund, K., Jowitt, S. M., Nguyen, T. P., et al. (2020). Reviewing the Material and Metal Security of Low-Carbon Energy Transitions. Renew. Sustain. Energy Rev. 124, 109789. doi:10.1016/j.rser.2020.109789
Lesser, P., Gugerell, K., Poelzer, G., Hitch, M., and Tost, M. (2021). European Mining and the Social License to Operate. Extr. Industries Soc. 8 (2), 100787. doi:10.1016/j.exis.2020.07.021
Li, H., Eksteen, J., and Kuang, G. (2019). Recovery of Lithium From Mineral Resources: State-Of-The-Art and Perspectives – A Review. Hydrometallurgy 189, 105129. doi:10.1016/j.hydromet.2019.105129
Lisitsin, V. A., González-Álvarez, I., and Porwal, A. (2013). Regional Prospectivity Analysis for Hydrothermal-Remobilised Nickel Mineral Systems in Western Victoria, Australia. Ore Geol. Rev. 52, 100–112. doi:10.1016/j.oregeorev.2012.04.001
Lisitsin, V. A., Porwal, A., and McCuaig, T. C. (2014). Probabilistic Fuzzy Logic Modeling: Quantifying Uncertainty of Mineral Prospectivity Models Using Monte Carlo Simulations. Math. Geosci. 46 (6), 747–769. doi:10.1007/s11004-014-9534-1
Liu, W., and Agusdinata, D. B. (2020). Interdependencies of Lithium Mining and Communities Sustainability in Salar de Atacama, Chile. J. Clean. Prod. 260, 120838. doi:10.1016/j.jclepro.2020.120838
London, D. (2005). Granitic Pegmatites: An Assessment of Current Concepts and Directions for the Future. Lithos 80 (1–4), 281–303. doi:10.1016/j.lithos.2004.02.009
Månberger, A., and Stenqvist, B. (2018). Global Metal Flows in the Renewable Energy Transition: Exploring the Effects of Substitutes, Technological Mix and Development. Energy Policy 119, 226–241. doi:10.1016/j.enpol.2018.04.056
Mancheri, N. A., Sprecher, B., Bailey, G., Ge, J., and Tukker, A. (2019). Effect of Chinese Policies on Rare Earth Supply Chain Resilience. Resour. Conservation Recycl. 142, 101–112. doi:10.1016/j.resconrec.2018.11.017
Marconi, P., Arengo, F., and Clark, A. (2022). The Arid Andean Plateau Waterscapes and the Lithium Triangle: Flamingos as Flagships for Conservation of High-Altitude Wetlands Under Pressure From Mining Development. Wetl. Ecol. Manag. 30 (4), 827–852. doi:10.1007/s11273-022-09872-6
Martinez-Alier, J. (2021). Mapping Ecological Distribution Conflicts: The EJAtlas. Extr. Industries Soc. 8 (4), 100883. doi:10.1016/j.exis.2021.02.003
Maybee, B., Lilford, E., and Hitch, M. (2023). Environmental, Social and Governance (ESG) Risk, Uncertainty, and the Mining Life Cycle. Extr. Industries Soc. 14, 101244. doi:10.1016/j.exis.2023.101244
Melton, J. R., Chan, E., Millard, K., Fortier, M., Winton, R. S., Martín-López, J. M., et al. (2022). A Map of Global Peatland Extent Created Using Machine Learning (Peat-ML). Geosci. Model Dev. 15 (12), 4709–4738. doi:10.5194/gmd-15-4709-2022
Mensah, L. (2021). Legal Pluralism in Practice: Critical Reflections on the Formalisation of Artisanal and Small-Scale Mining (ASM) and Customary Land Tenure in Ghana. Extr. Industries Soc. 8 (4), 100973. doi:10.1016/j.exis.2021.100973
Michaux, S. P. (2021). Assessment of the Extra Capacity Required of Alternative Energy Electrical Power Systems to Completely Replace Fossil Fuels: Geological Survey of Finland Circular Economy Solutions KTR Espoo. Espoo, Finland: GTK Open File Work Report 42/2021, 100.
Mihalasky, M. J., Briggs, D. A., Baker, M. S., Jaskula, B. W., Cheriyan, K., and Deloach-Overton, S. W. (2020). Lithium Occurrences and Processing Facilities of Argentina, and Salars of the Lithium Triangle, Central South America. Spokane, WA: United States Geological Survey.
Moodaley, W., and Telukdarie, A. (2023). Greenwashing, Sustainability Reporting, and Artificial Intelligence: A Systematic Literature Review. Sustainability 15 (2), 1481. doi:10.3390/su15021481
Mudd, G. M. (2010). The Environmental Sustainability of Mining in Australia: Key Mega-Trends and Looming Constraints. Resour. Policy 35 (2), 98–115. doi:10.1016/j.resourpol.2009.12.001
Mudd, G. M. (2021). Assessing the Availability of Global Metals and Minerals for the Sustainable Century: From Aluminium to Zirconium. Sustainability 13 (19), 10855. doi:10.3390/su131910855
Mudd, G. M., and Jowitt, S. M. (2018). Growing Global Copper Resources, Reserves and Production: Discovery Is Not the Only Control on Supply. Econ. Geol. 113 (6), 1235–1267. doi:10.5382/econgeo.2018.4590
Müller, A., Simmons, W., Beurlen, H., Thomas, R., Ihlen, P. M., Wise, M., et al. (2018). A Proposed New Mineralogical Classification System for Granitic Pegmatites – Part I: History and the Need for a New Classification. Can. Mineralogist 60 (2), 203–227. doi:10.3749/canmin.1700088
Munk, L. A., Hynek, S. A., Bradley, D. C., Boutt, D., Labay, K., and Jochens, H. (2016). “Lithium Brines: A Global Perspective,” in Rare Earth and Critical Elements in Ore Deposits. Editors P. L. Verplanck, and M. W. Hitzman (Littleton, CO: Society of Economic Geologists), Reviews in Economic Geology, v. 18, 339–365. doi:10.5382/Rev.18.14
Newbold, T., Hudson, L. N., Arnell, A. P., Contu, S., De Palma, A., Ferrier, S., et al. (2016). Has Land Use Pushed Terrestrial Biodiversity Beyond the Planetary Boundary? A Global Assessment. Science 353 (6296), 288–291. doi:10.1126/science.aaf2201
Northey, S. A., Mudd, G. M., Werner, T. T., Jowitt, S. M., Haque, N., Yellishetty, M., et al. (2017). The Exposure of Global Base Metal Resources to Water Criticality, Scarcity and Climate Change. Glob. Environ. Change 44, 109–124. doi:10.1016/j.gloenvcha.2017.04.004
O’Brien, S. P. (2010). Crisis Early Warning and Decision Support: Contemporary Approaches and Thoughts on Future Research. Int. Stud. Rev. 12 (1), 87–104. doi:10.1111/j.1468-2486.2009.00914.x
Owen, J., Lébre, E., and Kemp, D. (2022). Energy Transition Minerals (ETMs): A Global Dataset of Projects. Brisbane, QLD: University of Queensland.
Owen, J. R., Kemp, D., Harris, J., Lechner, A. M., and Lèbre, É. (2022). Fast Track to Failure? Energy Transition Minerals and the Future of Consultation and Consent. Energy Res. Soc. Sci. 89, 102665. doi:10.1016/j.erss.2022.102665
Owen, J. R., Kemp, D., Lèbre, É., Svobodova, K., and Pérez Murillo, G. (2020). Catastrophic Tailings Dam Failures and Disaster Risk Disclosure. Int. J. Disaster Risk Reduct. 42, 101361. doi:10.1016/j.ijdrr.2019.101361
Owen, J. R., Kemp, D., Lechner, A. M., Harris, J., Zhang, R., and Lèbre, É. (2023). Energy Transition Minerals and Their Intersection With Land-Connected Peoples. Nat. Sustain. 6 (2), 203–211. doi:10.1038/s41893-022-00994-6
Owen, J. R., Kemp, D., and Marais, L. (2021). The Cost of Mining Benefits: Localising the Resource Curse Hypothesis. Resour. Policy 74, 102289. doi:10.1016/j.resourpol.2021.102289
Pandyaswargo, A. H., Wibowo, A. D., Maghfiroh, M. F. N., Rezqita, A., and Onoda, H. (2021). The Emerging Electric Vehicle and Battery Industry in Indonesia: Actions Around the Nickel Ore Export Ban and a SWOT Analysis. Batteries 7 (4), 80. doi:10.3390/batteries7040080
Patterson, D. H., Schmitt, S., Izquierdo, P., Tibaldeschi, P., Bellfield, H., Wang, D., et al. (2022). Geospatial ESG: The Emerging Application of Geospatial Data for Gaining 'Environmental’ Insights on the Asset, Corporate and Sovereign Level. World Bank. Group Rep. 168898, 37.
Patterson, D. J., Ariel, Y., Burks, B., Gratcheva, E. M., Hosking, J. S., Klein, N., et al. (2020). Spatial Finance: Challenges and Opportunities in a Changing World. Available at: https://openknowledge.worldbank.org/handle/10986/34894.
Pebesma, E. (2018). Simple Features for R: Standardized Support for Spatial Vector Data. R J. 10 (1), 439–446. doi:10.32614/rj-2018-009
Pell, R., Tijsseling, L., Goodenough, K., Wall, F., Dehaine, Q., Grant, A., et al. (2021). Towards Sustainable Extraction of Technology Materials Through Integrated Approaches. Nat. Rev. Earth Environ. 2 (10), 665–679. doi:10.1038/s43017-021-00211-6
Petavratzi, E., Sanchez-Lopez, D., Hughes, A., Stacey, J., Ford, J., and Butcher, A. (2022). The Impacts of Environmental, Social and Governance (ESG) Issues in Achieving Sustainable Lithium Supply in the Lithium Triangle. Mineral. Econ. 35 (3), 673–699. doi:10.1007/s13563-022-00332-4
Poggio, L., de Sousa, L. M., Batjes, N. H., Heuvelink, G. B. M., Kempen, B., Ribeiro, E., et al. (2021). SoilGrids 2.0: Producing Soil Information for the Globe With Quantified Spatial Uncertainty. SOIL 7 (1), 217–240. doi:10.5194/soil-7-217-2021
Prno, J. (2013). An Analysis of Factors Leading to the Establishment of a Social Licence to Operate in the Mining Industry. Resour. Policy 38 (4), 577–590. doi:10.1016/j.resourpol.2013.09.010
Rico, M., Benito, G., Salgueiro, A. R., Díez-Herrero, A., and Pereira, H. G. (2008). Reported Tailings Dam Failures: A Review of the European Incidents in the Worldwide Context. J. Hazard. Mater. 152 (2), 846–852. doi:10.1016/j.jhazmat.2007.07.050
Risacher, F., and Fritz, B. (2009). Origin of Salts and Brine Evolution of Bolivian and Chilean Salars. Aquat. Geochem. 15 (1), 123–157. doi:10.1007/s10498-008-9056-x
Roberts, D. R., Bahn, V., Ciuti, S., Boyce, M. S., Elith, J., Guillera-Arroita, G., et al. (2017). Cross-Validation Strategies for Data With Temporal, Spatial, Hierarchical, or Phylogenetic Structure. Ecography 40 (8), 913–929. doi:10.1111/ecog.02881
Rosenau-Tornow, D., Buchholz, P., Riemann, A., and Wagner, M. (2009). Assessing the Long-Term Supply Risks for Mineral Raw Materials—A Combined Evaluation of Past and Future Trends. Resour. Policy 34 (4), 161–175. doi:10.1016/j.resourpol.2009.07.001
Rossi, C., Byrne, J. G. D., and Christiaen, C. (2024). Breaking the ESG Rating Divergence: An Open Geospatial Framework for Environmental Scores. J. Environ. Manag. 349, 119477. doi:10.1016/j.jenvman.2023.119477
Savinova, E., Evans, C., Lèbre, É., Stringer, M., Azadi, M., and Valenta, R. K. (2023). Will Global Cobalt Supply Meet Demand? The Geological, Mineral Processing, Production and Geographic Risk Profile of Cobalt. Resour. Conservation Recycl. 190, 106855. doi:10.1016/j.resconrec.2022.106855
Schiavina, M., Freire, S., and MacManus, K. (2022). Global Human Settlement Layer (GHSL): European Commission, Joint Research Centre (JRC), V. GHS Population Grid Multitemporal (1975-2030).
Shedlock, K. M., Giardini, D., Grunthal, G., and Zhang, P. (2000). The GSHAP Global Seismic Hazard Map. Seismol. Res. Lett. 71 (6), 679–686. doi:10.1785/gssrl.71.6.679
Smits, J., and Permanyer, I. (2019). The Subnational Human Development Database. Sci. Data 6 (1), 190038. doi:10.1038/sdata.2019.38
Sonter, L. J., Dade, M. C., Watson, J. E. M., and Valenta, R. K. (2020). Renewable Energy Production Will Exacerbate Mining Threats to Biodiversity. Nat. Commun. 11 (1), 4174. doi:10.1038/s41467-020-17928-5
Spawn, S. A., Sullivan, C. C., Lark, T. J., and Gibbs, H. K. (2020). Harmonized Global Maps of Above and Below Ground Biomass Carbon Density in the Year 2010. Sci. Data 7 (1), 112. doi:10.1038/s41597-020-0444-4
Stanley, C. J., Jones, G. C., Rumsey, M. S., Blake, C., Roberts, A. C., Stirling, J. A. R., et al. (2007). Jadarite, LiNaSiB3O7(OH), a New Mineral Species From the Jadar Basin, Serbia. Eur. J. Mineralogy 19, 575–580. doi:10.1127/0935-1221/2007/0019-1741
Stemn, E., Hassall, M. E., and Bofinger, C. (2020). Planning and Implementing Remedial Measures From Incident Investigations: A Study of the Ghanaian Mining Industry. Saf. Sci. 127, 104735. doi:10.1016/j.ssci.2020.104735
Stewart, I. (2023). Geology for the Wellbeing Economy. Nat. Geosci. 16 (2), 106–107. doi:10.1038/s41561-022-01110-1
Uyar, A., Kuzey, C., and Karaman, A. S. (2022). ESG Performance and CSR Awards: Does Consistency Matter? Finance Res. Lett. 50, 103276. doi:10.1016/j.frl.2022.103276
Valenta, R. K., Kemp, D., Owen, J. R., Corder, G. D., and Lèbre, É. (2019). Re-Thinking Complex Orebodies: Consequences for the Future World Supply of Copper. J. Clean. Prod. 220, 816–826. doi:10.1016/j.jclepro.2019.02.146
van Donkelaar, A., Hammer, M. S., Bindle, L., Brauer, M., Brook, J. R., Garay, M. J., et al. (2021). Monthly Global Estimates of Fine Particulate Matter and Their Uncertainty. Environ. Sci. Technol. 55 (22), 15287–15300. doi:10.1021/acs.est.1c05309
van Duuren, E., Plantinga, A., and Scholtens, B. (2016). ESG Integration and the Investment Management Process: Fundamental Investing Reinvented. J. Bus. Ethics 138 (3), 525–533. doi:10.1007/s10551-015-2610-8
Vivoda, V. (2023). Friend-Shoring and Critical Minerals: Exploring the Role of the Minerals Security Partnership. Energy Res. Soc. Sci. 100, 103085. doi:10.1016/j.erss.2023.103085
Vivoda, V., and Kemp, D. (2019). How Do National Mining Industry Associations Compare on Sustainable Development? Extr. Industries Soc. 6 (1), 22–28. doi:10.1016/j.exis.2018.06.002
Vivoda, V., and Matthews, R. (2023). “Friend-Shoring” as a Panacea to Western Critical Mineral Supply Chain Vulnerabilities. Mineral. Econ. doi:10.1007/s13563-023-00402-1
Wadoux, A. M. J.-C., Heuvelink, G. B. M., de Bruin, S., and Brus, D. J. (2021). Spatial Cross-Validation Is Not the Right Way to Evaluate Map Accuracy. Ecol. Model. 457, 109692. doi:10.1016/j.ecolmodel.2021.109692
Walsh, S. D. C., Northey, S. A., Huston, D., Yellishetty, M., and Czarnota, K. (2020). Bluecap: A Geospatial Model to Assess Regional Economic-Viability for Mineral Resource Development. Resour. Policy 66, 101598. doi:10.1016/j.resourpol.2020.101598
Watari, T., Nansai, K., Nakajima, K., and Giurco, D. (2021). Sustainable Energy Transitions Require Enhanced Resource Governance. J. Clean. Prod. 312, 127698. doi:10.1016/j.jclepro.2021.127698
Wickham, H., Averick, M., Bryan, J., Chang, W., McGowan, L. D., François, R., et al. (2019). Welcome to the Tidyverse. J. Open Source Softw. 4 (43), 1686. doi:10.21105/joss.01686
Wickramasinghe, I., and Kalutarage, H. (2021). Naive Bayes: Applications, Variations and Vulnerabilities: A Review of Literature With Code Snippets for Implementation. Soft Comput. 25 (3), 2277–2293. doi:10.1007/s00500-020-05297-6
Wily, L., and Tagliarino, A. (2018). Indicators of the Legal Security of Indigenous and Community Lands: LandMark: The Global Platform of Indigenous and Community Lands.
Winsemius, H. C., Jongman, B., Veldkamp, T. I. E., Hallegatte, S., Bangalore, M., and Ward, P. J. (2018). Disaster Risk, Climate Change, and Poverty: Assessing the Global Exposure of Poor People to Floods and Droughts. Environ. Dev. Econ. 23 (3), 328–348. doi:10.1017/s1355770x17000444
Yunis, J., and Aliakbari, E. (2021). Annual Survey of Mining Companies. Vancouver, BC: Fraser Institute, 84.
Keywords: machine learning, sustainability, critical mineral, sustainable development, mineral potential, geoscience, ESG, deep learning techniques
Citation: Lawley CJM, Haynes M, Chudasama B, Goodenough K, Eerola T, Golev A, Zhang SE, Park J and Lèbre E (2024) Geospatial Data and Deep Learning Expose ESG Risks to Critical Raw Materials Supply: The Case of Lithium. Earth Sci. Syst. Soc. 4:10109. doi: 10.3389/esss.2024.10109
Received: 20 January 2024; Accepted: 20 June 2024;
Published: 04 July 2024.
Edited by:
Christopher M. Yeomans, Cornish Lithium, United KingdomReviewed by:
Matthew Cracknell, University of Tasmania, AustraliaMatthew Grimshaw, Satarla, United Kingdom
Copyright © 2024 Lawley, Haynes, Chudasama, Goodenough, Eerola, Golev, Zhang, Park and Lèbre. This is an open-access article distributed under the terms of the Creative Commons Attribution License (CC BY). The use, distribution or reproduction in other forums is permitted, provided the original author(s) and the copyright owner(s) are credited and that the original publication in this journal is cited, in accordance with accepted academic practice. No use, distribution or reproduction is permitted which does not comply with these terms.
*Correspondence: Christopher J. M. Lawley, Y2hyaXN0b3BoZXIubGF3bGV5QG5yY2FuLXJuY2FuLmdjLmNh