 Rosie Blannin1,2*
 Max Frenzel2
 Raimon Tolosana-Delgado2Kai Bachmann2Alexandra Gomez Escobar3†
 Lucas Pereira2
 Jens Gutzmer2
- 1WH Bryan Mining Geology Research Centre, Sustainable Minerals Institute, University of Queensland, Brisbane, Australia
- 2Helmholtz-Zentrum Dresden-Rossendorf, Helmholtz Institute Freiberg for Resource Technology, Freiberg, Germany
- 3Faculdade de Ciências, Instituto Dom Luiz, Universidade de Lisboa, Lisboa, Portugal
Tailings generated during ore processing may host significant residual contents of valuable commodities, including critical metals. The particle properties of the tailings, such as mineralogy, particle size, and the surface liberation of ore minerals, strongly control processing behaviour. This study explores a novel combination of methods for incorporating particle data, derived from automated mineralogy, into geometallurgical models of tailings deposits to better understand their reprocessing potential and the economic feasibility of re-mining. This was achieved through binning of different particle types, geostatistical modelling of particle bin frequencies, and bootstrap resampling to reconstruct particle populations. The spatial distributions of processing-relevant particle properties throughout the tailings deposit were predicted with corresponding uncertainties. There are clear systematic trends in the spatial distributions of different particle types, resulting from the sedimentary-style deposition of the tailings. For instance, the tailings nearer the dam walls comprise coarser, silicate-rich particles, while fine-grained and well-liberated sulphide mineral particles are more abundant in the centre of the tailings deposit. As a result, robust models could be developed for the spatial distributions of particle size and mineralogy, which strongly control the sorting of particles during deposition, and other related properties, such as sulphide mineral grain sizes. Finally, a bulk sulphide flotation process was simulated and acid mine drainage potential estimated using the interpolated particle data. Around 58% of the sulphide minerals present could be recoverable by flotation, with the recoverable sulphide portion decreasing towards the centre of the TSF due to the fine-grained nature of the sulphide minerals. The acid mine drainage potential of the tailings is estimated to be moderate to high, indicating that the carbonate minerals present are not sufficient to neutralise the high acid-generating potential of the sulphide minerals. Overall, this study demonstrates how particle-based geometallurgical models can be developed and utilised for practical applications, with the aim of improving the accuracy of resource and reserve estimations of tailings deposits and the sustainable and responsible management of anthropogenic resources. The methodology proposed here can be easily transferred to other tailings deposits.
Introduction
The mining and processing of most metalliferous ores produces a much higher volume of waste than of valuable product(s) (e.g., Dold, 2020; Lottermoser, 2011). Tailings are the chief waste product from ore processing and comprise fine-grained particles, generally in a slurry, from which the bulk of the ore minerals have been removed by suitable beneficiation technologies (Wills and Finch, 2015). The volume of tailings generated worldwide will increase as the industry shifts towards the mining of deeper, lower-grade ore deposits and expands to meet the needs of the green energy transition (Franks et al., 2021; Herrington, 2021; Valenta et al., 2023). An estimated ∼300 Gt of tailings will be produced between 2020 and 2050, around 2.4 times the amount produced over the period from 1900 to 2020 (Valenta et al., 2023). The management, storage and/or re-use of historical, current, and future mine wastes is thus one of the most important challenges for society and the global mining industry.
Tailings repositories often contain residual contents of the target mineral(s) (Dold, 2020; Rupprecht, 2020; Valenta et al., 2023). Elements critical for the green energy transition, which were not previously targeted by minerals processing, may also be present (e.g., Araya et al., 2021; Mejías et al., 2023). Re-processing to recover valuable commodities from tailings may prove to be economically feasible with current or future technologies, helping to meet raw material demands while reducing the volumes of waste to be stored (e.g., Vitti and Arnold, 2022; Whitworth et al., 2022). Re-processing should also aim to produce a “clean” residue that can be valorised (e.g., El-bouazzaoui et al., 2022; Kinnunen et al., 2022). Already, tailings have been used successfully to make cement (Gou et al., 2019; Martins et al., 2021), geopolymers (Mabroum et al., 2020; Niu et al., 2022; 2020), ceramics (Drif et al., 2021; Karhu et al., 2019; Veiga Simão et al., 2021b; 2021a) and “mineral sands” (Golev et al., 2022).
Ideally, the assessment of the resource potential of tailings storage facilities (TSF) should include geometallurgical characterisation and modelling (Büttner et al., 2018). Geometallurgy integrates available geological, geochemical, and mineralogical knowledge with factors that influence all stages of the mining value chain, such as mining/geotechnical engineering, processing, metallurgy, and geoenvironmental aspects (Dominy et al., 2018; Frenzel et al., 2023; Hoal and Frenzel, 2022; Hunt et al., 2019). Important geometallurgical inputs include primary properties, i.e., those intrinsic to the ore such as mineralogy, mineral associations, mineral grain sizes, and secondary properties, i.e., response variables that measure the processing behaviour of the ore such as flotation recovery, throughput, and grindability (Coward et al., 2009).
Due to the particulate nature of tailings, the geometallurgy of tailings deposits is somewhat different to that of most geogenic (primary) deposits. In tailings, ore minerals are commonly locked in complex particles (together with gangue minerals) which would be challenging to recover with the standard beneficiation technologies used at the time of their production. As such, properties including particle size, liberation, and surface area of the valuable minerals, are of importance. Numerous studies have performed quantitative mineralogical and textural characterisation of tailings deposits. For example (Mulenshi et al., 2019), studied tailings from the Yxsjöberg tailings deposit to investigate both primary and secondary properties related to remediation and the recovery of critical minerals. Guanira et al. (2020) investigated ore mineralogy and environmental behaviour, namely deportment of penalty elements and the acid-generating and -neutralising potential of tailings from a Cu(-Au-Ag) skarn deposit.
Furthermore, TSFs are heterogeneous in nature due to processes occurring both during and after tailings deposition. Firstly, the sedimentary-style deposition of slurry tailings results in the sorting of particles away from spill points by size and density (e.g., Nikonow et al., 2019; Vick, 1990; Weightman et al., 2021). Thus, the distribution of different particle types within a TSF is not uniform, creating trends in chemical composition (e.g., Blannin et al., 2022b). Secondly, near-surface weathering and oxidation processes may alter the chemistry, mineralogy and textural properties of tailings, particularly in sulphidic materials (e.g., Dold, 2017; Elghali et al., 2023; 2019; Simate and Ndlovu, 2014). The formation of hardpan layers may inhibit the further advance of the oxidation front, preventing oxidation of the deeper, water-saturated tailings (e.g., Elghali et al., 2019; Lindsay et al., 2015; Redwan et al., 2012). Additionally, ore composition, processing method, and tailings deposition may vary over time, changing the mineralogy, textural properties and spatial distributions of particle types within the TSF (e.g., Nikonow et al., 2019; Tripodi et al., 2019; Weightman et al., 2021). These factors must be considered when geospatially modelling a TSF. In particular, samples from the oxidised zone cannot be assumed to represent “fresh” tailings and may make interpolation to depth difficult.
After the quantitative geometallurgical characterisation of tailings, the next logical step is the interpolation of relevant variables across 3D space. Geometallurgical datasets are typically highly multivariate, containing many samples and variables with complex inter-dependencies and spatial relationships (e.g., Boisvert et al., 2013), while secondary properties (e.g., grindability, flotation recovery) are sparsely sampled compared to primary properties, and are often measured at different scales (e.g., Coward et al., 2009; Deutsch et al., 2016). Furthermore, some geometallurgical properties are non-additive, i.e., they cannot be averaged linearly (Coward et al., 2009), meaning that linear interpolation methods cannot be used.
These inherent properties of geometallurgical datasets can complicate modelling efforts. A simple method to produce geometallurgical models involves interpolating additive properties (geochemistry), followed by linear or non-linear regression to predict primary or secondary geometallurgical variables, including non-additive parameters (Boisvert et al., 2013; Rincon et al., 2019a; 2019b; Rossi and Deutsch, 2014; Tungpalan et al., 2021). More sophisticated interpolators, such as geostatistical methods, particularly conditional simulations for non-additive properties (Abildin et al., 2019; Adeli et al., 2021; Deutsch et al., 2016; Louwrens, 2016; Prior et al., 2021), or machine learning-based methods (Lishchuk et al., 2019; Mena Silva et al., 2020) can also be applied to integrate both primary and secondary geometallurgical properties into spatial models. As yet, simple linear regression and interpolation models, in addition to geostatistical methods, have been used to model geometallurgical variables specifically in tailings deposits (Blannin et al., 2022a; Büttner et al., 2018; Louwrens, 2016).
Ore properties relevant for geometallurgical studies can be quantified with Scanning Electron Microscope (SEM)-based image analysis techniques, also known as automated mineralogy (e.g., Fandrich et al., 2007; Schulz et al., 2020). Automated mineralogy provides vital information on primary geometallurgical properties, e.g., mineral associations and mineralogy in intact ore, and particle size, shape, and mineral liberation characteristics in milled materials. In fact, the advantages of particle data have long been recognised (e.g., Gaudin, 1939; King et al., 2012) although the tools to generate such particle data were not available early on. The large amounts of particle data generated by automated mineralogy methods can be challenging to work with and are generally under-utilised, with only bulk properties calculated. More recently, Kupka et al. (2020), Pereira et al. (2021b) and Schach et al. (2019) have performed process modelling, making use of particle data from automated mineralogy.
Particle-based data are particularly relevant for understanding the in-situ material properties of tailings, being particulate materials. Therefore, particle data should ideally be integrated into geometallurgical models of TSFs to provide the information relevant to processing and environmental behaviour. Specifically, geometallurgical models could focus on particle populations, from which the relevant variables can be derived. The challenge in this case is the spatial interpolation of highly multivariate particle datasets. To address this need, this study introduces a new method to construct a geometallurgical model of a tailings deposit incorporating detailed particle population data.
The case study in question is the Davidschacht TSF in Freiberg, Germany. To date, the geochemistry of the tailings has been modelled for a 2D layer (Blannin et al., 2022b) and in 3D (Blannin et al., 2023), focusing on valuable (Cu, Zn, Pb, and In) and hazardous (As, Cd) components. Furthermore, mineralogical and textural properties were considered via linear regression models by Blannin et al. (2022a). The main objective of the present study is to interpolate particle populations and accurately reproduce the primary geometallurgical properties of the tailings. Ultimately, the resultant particle-based spatial model could be used as direct input into a particle-based processing model (e.g., Pereira et al., 2021b) to simulate the beneficiation response of the deposit. The particle data can also be used to infer or model environmental behaviour of tailings. Therefore, this study represents an important step towards the integration of geometallurgical models with particle-based processing simulations for tailings deposits. Such modelling can improve the accuracy of mineral reserve estimations by providing robust predictions of mineral recoveries and can contribute towards the sustainable management and responsible exploitation of natural and anthropogenic resources.
Materials and Methods
Case Study
The Davidschacht TSF (Figure 1A), originates from the froth flotation of sphalerite-pyrite-quartz and galena-quartz ± carbonate veins of the central portion of the historic Freiberg Mining District (Swinkels et al., 2021). The ores were processed in the 1940s–60s to recover Zn, Pb, and minor amounts of Cu and Ag (Fritz and Jahns, 2017) and the Davidschacht TSF mainly operated between 1951 and 1964 (Fritz and Jahns, 2017; G.E.O.S., 1993). The tailings are ∼20–30 m deep, with a surface area of ∼63,000 m2 and a volume of ∼760,000 m3 (Fritz and Jahns, 2017). An aerial photograph of the Davidschacht TSF from 1967, after tailings deposition ceased, is shown in Figure 1B. Notable contents of pyrite, arsenopyrite, sphalerite, chalcopyrite and galena remain in the tailings (Martin et al., 2015; Redwan et al., 2012), corresponding to grades of around 0.4 wt. % Zn, 0.2 wt. % Pb, 0.05 wt. % Cu, and 9 g/t In (e.g., Blannin et al., 2023; Fritz and Jahns, 2017; G.E.O.S., 1993; Martin et al., 2015).
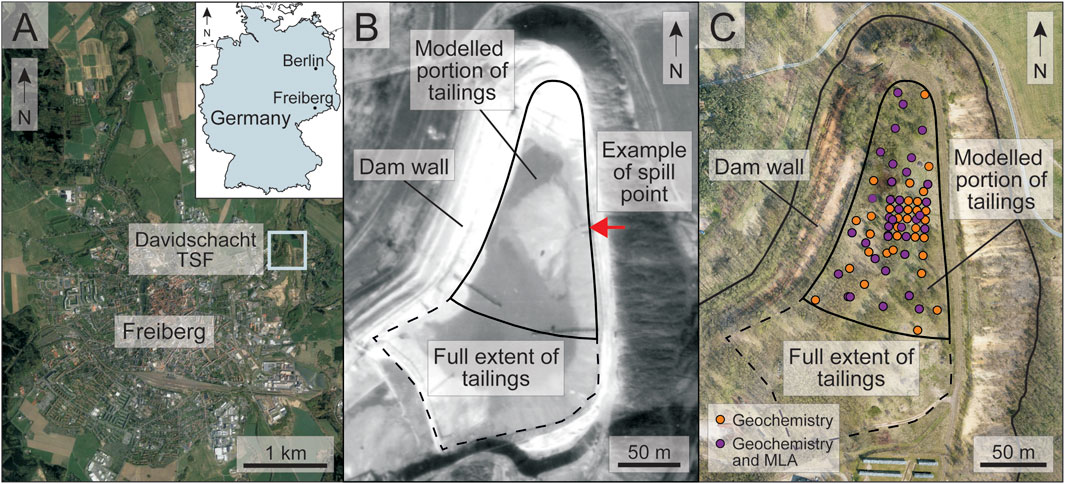
Figure 1. (A) A map indicating the location of the Davidschacht TSF in Freiberg. (B) An aerial photograph of the Davidschacht TSF taken in 1967, with the location of a known spill point indicated by the red arrow, and the extent of the tailings and modelled regions outlined. (C) A map of the tailings deposit with the sampled locations and the extent of the tailings and modelled regions outlined. Samples with only geochemical data are marked with an orange circle and samples with geochemistry and MLA data are in purple. Modified after Blannin et al. (2022a).
Sampling and Analytical Work
A shallow layer (1–3 m) of the Davidschacht TSF was sampled on a grid of 30 m, nested grids of ∼15 m and ∼7.5 m, plus random holes and twin holes, for a total of 68 samples (Figure 1C). This sample configuration was selected to best fit the size and shape of the TSF and to assess the horizontal variability at various scales. Sampling was limited to the northern zone of the TSF due to the presence of widespread rubble and soils on the southern section, which prevented drilling. The first meter of tailings was largely or fully oxidised and was therefore removed as not representative of the tailings deposit as a whole. The analysed material, from 1 to 3 m, was almost entirely fresh tailings.
The geochemistry of all samples was analysed with X-ray fluorescence spectroscopy (XRF) at the Helmholtz Institute Freiberg for Resource Technology (HIF). The analyses focused on the major elements and oxides present in the tailings (SiO2, Al2O3, K2O, CaO, Fe, and S), as well as the valuable (Cu, Zn, Pb, and In) and hazardous (As, Cd) elements. For further details on the sampling, sample preparation and geochemical analyses, see Blannin et al. (2022b).
Thirty-six samples from across the TSF (Figure 1C) were analysed with the Mineral Liberation Analyzer (MLA), an automated mineralogy system (Fandrich et al., 2007), to obtain mineralogical and textural data for individual particles. The sample preparation and MLA measurements were carried out at HIF. For information on the sample preparation, SEM and MLA operating conditions, and data processing, see the Supplementary Material.
A total of 11 minerals/mineral groups were defined, as detailed in Supplementary Table S2. Gangue minerals mainly comprise silicate and sheet silicate minerals, carbonate minerals and Fe-oxides. The sulphide minerals, being the main focus of the study, were investigated individually, rather than being grouped, and include pyrite, sphalerite, chalcopyrite, galena, and arsenopyrite. The data quality of the MLA measurements is also of importance, and these results are provided in provided in the Supplementary Material. To summarise, the complex and fine-grained nature of the tailings and presence of secondary phases poses difficulties for automated mineralogy analyses of such materials. These factors have resulted in some systematic under-estimation of the metals of interest. However, the results obtained here are generally good and the best that could be achieved with current practices and therefore this work serves as a valuable case study for particle-based geostatistical modelling.
Electron Probe Micro-Analysis (EPMA) point measurements were performed on pyrite (n = 482), sphalerite (n = 138), chalcopyrite (n = 9), arsenopyrite (n = 9) and galena (n = 6) grains from 10 selected samples to quantify their chemical composition, including trace elements. The measurements were performed at Faculdade de Ciências, Instituto Dom Luiz, Universidade de Lisboa. The EPMA method is detailed in the Supplementary Material. The mineral chemistries calculated from the EPMA results were subsequently used in the MLA mineral list.
Overview of the Modelling Workflow
This section provides a brief overview of the combination of methods developed for the spatial interpolation of particle populations, which is schematically illustrated in Figure 2. Three sets of data are used: geochemical data, the greyscale values of a historical aerial photo corresponding to the modelled layer of the tailings deposit (Figure 1B), and particle data obtained using MLA.
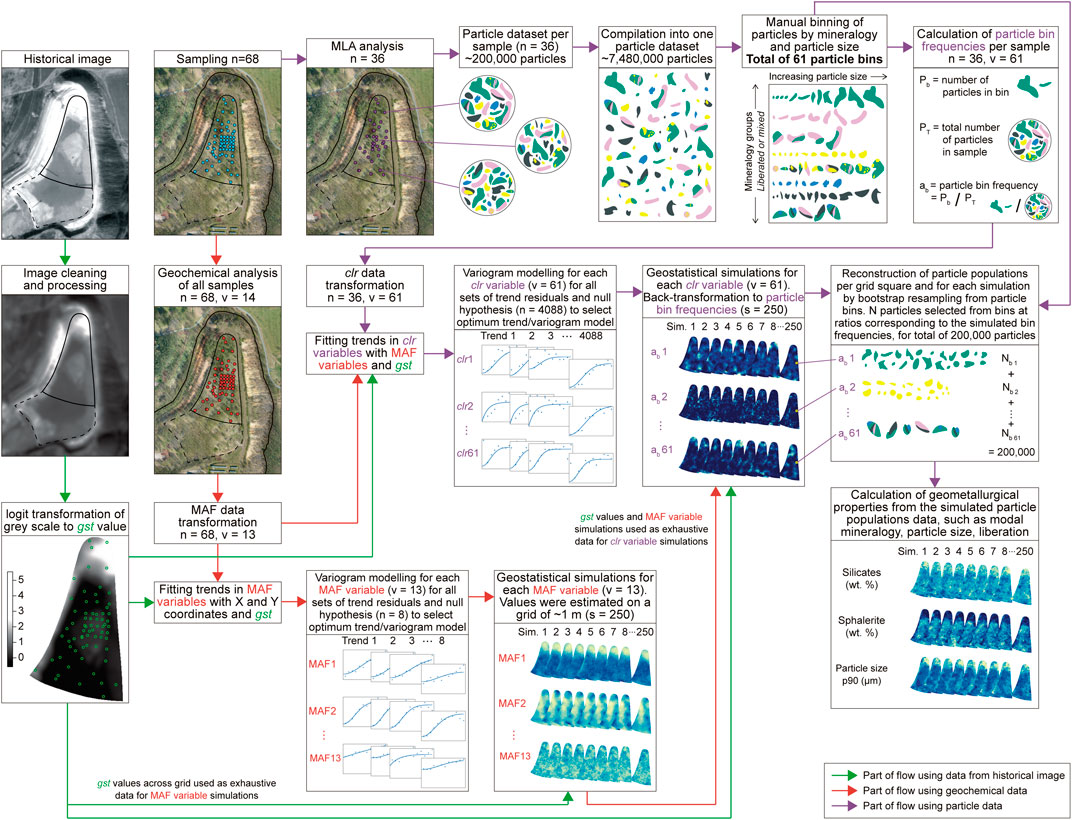
Figure 2. Schematic workflow of the modelling methods combined to interpolate the particle populations across the tailings deposit. n, number of samples; v, number of variables; s, number of simulations; N, number of particles sampled during bootstrap resampling; MAF, Minimum/Maximum Autocorrelation Factors; clr, centred log-ratio.
Firstly, geostatistical modelling was used to interpolate the contents of selected elements and oxides across the sampled layer of the tailings deposit. Universal sequential Gaussian simulation was selected as the best method to account for the spatial dependencies of this data (cf. Blannin et al., 2022b). A Minimum/Maximum Autocorrelation Factor transformation was applied to the geochemical data. Trends in the transformed data were fitted based on the X and Y coordinates and the greyscale from the historical photo, after several steps of image processing and data transformation. The geostatistical model was optimised by selecting the optimum trend-variogram model. Universal sequential Gaussian simulation was performed to produce 250 equi-probable realisations of the selected elements/oxides, using the historical image as the underlying exhaustive dataset (cf. Blannin et al., 2022b).
Next, the MLA particle data was binned based on certain primary particle properties: mineralogy and particle size. It was assumed that the same particle types are present across the whole sampled layer of the tailings deposit and that only their relative frequencies of occurrence vary spatially. The frequency of the individual particle bins in each sample was treated as compositional data and transformed using a centred log-ratio (clr) transformation. Again, universal sequential Gaussian simulation was chosen to interpolate the particle bin frequencies. The geochemical results (per sample) and historical image were used to fit the trends in the transformed data. After the optimum trend-variogram models were selected, universal sequential Gaussian simulation was applied to the particle bin frequencies, using the historical aerial photo and the simulated realisations of the bulk chemistry as exhaustive data. Finally, the particle populations for each grid point were constituted by bootstrap resampling of individual particles from the particle bins at the interpolated ratios. Selected geometallurgical properties were then calculated from the simulated particle populations.
The individual steps of the workflow are detailed further in the following sections. Overall, this integrated approach deals with the highly multivariate nature of the particle data and accounts for both the inter-dependencies and spatial dependencies in the data. Additionally, the non-additivity of many geometallurgical properties was accounted for by converting the particle data to additive particle bin frequencies and expressing these as functions of other additive properties (geochemistry and the greyscale of the historical image) (e.g., Adeli et al., 2021; Boisvert et al., 2013; Rossi and Deutsch, 2014). Applying conditional geostatistical simulations, such as sequential Gaussian simulation, also helps to address the non-additivity problem (Deutsch et al., 2016).
Binning of Particle Data
The MLA measurements generated a large amount of particle data, with a total of ∼7, 480,000 particles characterised across the 36 samples. The particle datasets were imported into R Studio (R Core Team, 2021) and combined into one particle dataset for data processing, using the “gmMLA” package developed at the HIF, as described by Kupka et al. (2020) and Pereira et al. (2021b, 2021a). The particle data available included mineralogical and textural properties of all individual particles, and the mineral grains constituting the particles. The relevant particle properties for this study are mineral contents, particle size, and grain size and surface liberation of the sulphide minerals. Several measures are available for particle size. The equivalent circle diameter (ECD) was selected for this study, as a simple, commonly used and well-understood single parameter to enable the understanding of particle sizes.
To define particle types, statistical clustering methods were first tested, including k-means, hierarchical clustering (e.g., Jain et al., 1999) and Gaussian mixture modelling (e.g., Sarkar et al., 2020; Scrucca et al., 2016). Clustering methods are unsupervised machine learning techniques which aim to group data in a way that maximises variability between clusters and minimises it within clusters (e.g., Jain et al., 1999; Xu and Wunsch, 2008). Ultimately, statistical clustering was unsuccessful. The particle data contains a high quantity of zeros (e.g., a particle comprised of only silicate minerals will have zeros in all mineral-content, surface-liberation, and grain-size cells related to other minerals), which is problematic for calculating the Euclidean distance matrices used in k-means and hierarchical clustering (e.g., Jain et al., 1999). Furthermore, Gaussian mixture modelling requires a multivariate normal distribution (e.g., Sarkar et al., 2020; Scrucca et al., 2016), which is not usually present for particle data.
A manual binning method was implemented to classify particles first according to mineralogy and second by particle size, with a total of 61 particle bins defined (Figure 3). Fully liberated particles of “silicate minerals,” “sheet silicate minerals,” “sulphide minerals” and “carbonate minerals” and “all remaining fully liberated particles” were assigned to separate groups. Three groups of mixed particles were defined: “mixed particles of silicate and sheet silicate minerals,” “mixed particles containing sulphide minerals,” and “all remaining mixed particles.” A set of percentiles of the log-transformed particle size, by number fraction, were used as upper and lower limits for the bins: <1%, 1%–5%, 5%–10%, 10%–25%, 25%–50%, 50%–75%, 75%–90%, 90%–95%, 95%–99%, >99%. Smaller bins were required at the extremes of the particle size distribution to reduce the smoothing effect of binning. Particle bins containing fewer than 10,000 particles (less than 0.1% of the complete particle dataset) were combined to decrease the workload for subsequent modelling stages.
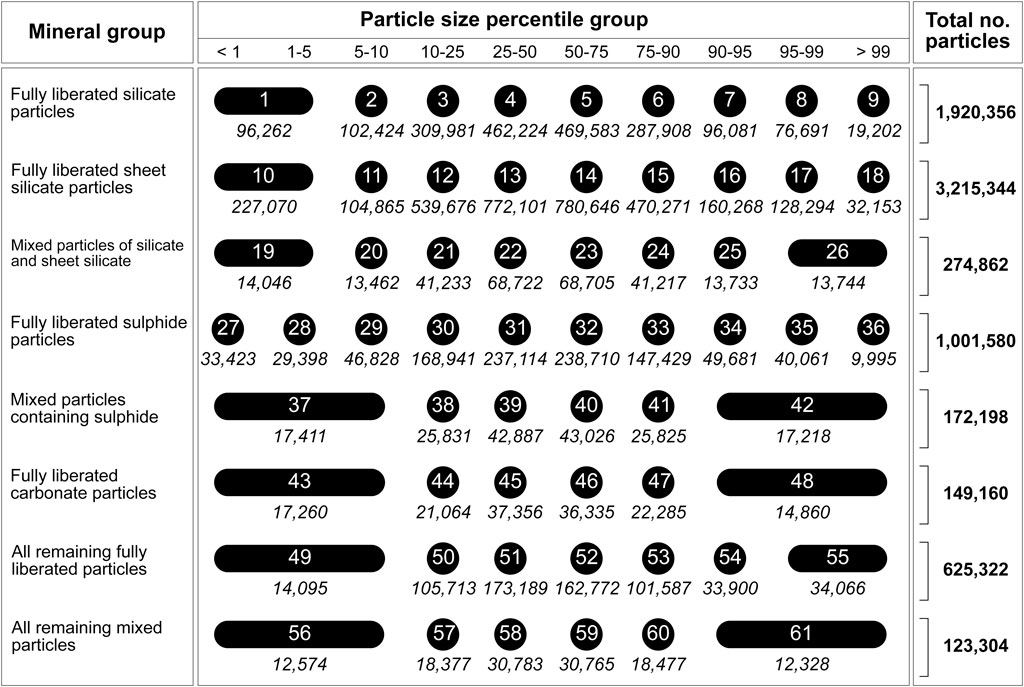
Figure 3. Summary of the particle bins based on mineralogy and particle size. The number in the black circle/ovals denotes the particle bin number while the number shown in italics below denotes the number of particles in the particle bin. The total number of particles in the right-hand column refers to the number of particles per mineral group. The number of particles per bin may vary slightly for bins covering the same percentile range due to the effects of discretisation of the particle sizes.
Particle bin frequencies of all 61 bins were calculated for each of the 36 samples according to Equation 1:
where
Geostatistical Modelling of Chemistry and Particle Bin Frequencies
Geostatistical modelling was performed to interpolate both the chemistry and particle bin frequencies across the sampled area of the Davidschacht TSF (Figure 2). The modelling was carried out in the R software (R Core Team, 2021), utilising relevant packages: “gstat” (Gräler et al., 2016; Pebesma, 2004), “compositions” (van den Boogaart et al., 2021) and “gmGeostat” (Tolosana-Delgado and Mueller, 2021a). Universal-kriging based sequential Gaussian simulation (USGSim) was performed to provide multiple equi-probable realisations of the chemistry and model the spatial uncertainty (Li et al., 2015; Deutsch and Journel, 1998; Matheron, 1969). This method involves modelling the local trend within a neighbourhood and therefore accounts for the spatial trends in the tailings composition which result from the sedimentary-style deposition of tailings. A similar approach was applied for the modelling of the chemistry and the particle bin frequencies, modified after and described in detail in Blannin et al. (2023, 2022b).
Prior to modelling, data transformations were necessary due to the spatial and compositional nature of the data. The chemistry variables included the grades of SiO2, Al2O3, K2O, CaO, MgO, Fe, S, Cu, Zn, Pb, As, Cd, and In, as well as an “other” variable required to close the data (Tolosana-Delgado et al., 2019). The Minimum/Maximum Autocorrelation Factor (MAF) transformation was applied to de-noise and de-correlate the geochemical data (Figure 2) (Switzer and Green, 1984; Tolosana-Delgado and Mueller, 2021b). The MAF transformation, and geostatistical analysis of MAF variables, has previously been implemented for tailings deposits (e.g., Abildin et al., 2019; Blannin et al., 2023; Karacan et al., 2023). The particle bin frequencies underwent a centred log-ratio (clr) transformation (Figure 2).
Sets of trend models were tested for both the MAF variables and clr variables. For the MAF variables, the trends were based on the X and Y coordinates and the grayscale values (gst) of the aerial photograph of the TSF, after image processing and a logit transformation (Figure 1B; see Blannin et al. (2022b) for further details). The trends in the clr variables were fitted with the MAF variables and the gst values (Figure 2). When including all possible combinations of the 13 MAF variables and gst values as potential explanatory variables, a very large number of trend function sets would be produced. Therefore, the set of trends was limited to combinations of up to 6 of the MAF variables plus gst, which totalled 4,088 possible trend sets when including a no-trend (null) hypothesis. After the selected trends were fitted to the MAF and clr variables, the trend residuals were transformed to a normal distribution using the ordered quantile normal score transformation (Peterson, 2021; Peterson and Cavanaugh, 2020). Empirical variograms were computed for the transformed values, with a maximum distance of 60 m and a lag distance of 5 m. Exponential and Gaussian variogram models, both with and without nugget, were tested. The optimum combination of trend and variogram model for each MAF and clr variable were selected as those with the lowest Akaike information criterion (AIC) value (Sakamoto et al., 1986), seeking a trade-off between a minimum number of model parameters and maximum goodness-of-fit.
USGSim (Li et al., 2015; Matheron, 1969) was implemented with the optimum trend-variogram model and local neighbourhood, to produce 250 realisations of each MAF variable describing the tailings chemistry (Figure 2). The modelling was performed on a grid of ∼1 m, within the outline of the sampled tailings area (Blannin et al., 2022b), and the gst values of the historical image at each grid point were used as exhaustive data. USGSim of the particle bin frequency clr variables was performed on the same grid, using the optimised trend-variogram model and local neighbourhood parameters (Figure 2). A total of 250 simulations of the clr variables were generated. For each realisation of the clr variables produced, a different realisation of the MAF variables was used as exhaustive data, in addition to the gst values from the historical image. Finally, the individual realisations of the clr variables for each grid point were back-transformed to produce 250 realisations of the 61 particle bin frequencies.
Leave-one-out cross-validation (e.g., Goovaerts, 1997) was used to validate the kriging models and to select the local neighbourhood used for running the simulations. Several arguments from the “gstat” package in R (Gräler et al., 2016; Pebesma, 2004; R Core Team, 2021) were used to define the local neighbourhood, which are defined as follows:
“maxdist” maximum distance for samples to be taken within the neighbourhood.
“nmin” number of samples within “maxdist” below which no interpolation is attempted.
“nmax” maximum number of data points to interpolate with.
“omax” number of data points to be used from each of the four quadrants around the interpolated location.
Using the leave-one-out cross-validation results, the Mean Error (ME), standardised Root Mean Squared Prediction Error (RSR), R2 value between observed and predicted values (Obs-Pred R2) and R2 value between predicted and residual values (Pred-Res R2) were calculated to evaluate the model performance. The RSR is calculated by dividing the Root Mean Squared Prediction Error by the standard deviation of the observed variable.
Reconstructing the Particle Populations Using Bootstrap Resampling
Bootstrap resampling was used to populate the 250 simulations with particles (Figure 2). This method involves generating M subsets by randomly selecting N samples from the original dataset with replacement (Chernick, 1999; Efron, 1979). In this study, particle datasets were generated for each grid point of the 250 simulations by bootstrap resampling from the particle bins at the numerical ratios corresponding to the simulated bin frequencies. To achieve this, the number of particles (N) to be selected for each particle bin was determined by multiplying the particle bin frequencies with the total number of particles required. A total of 200,000 particles was selected as the optimum number per grid point, being similar to the number of particles in the original samples. Overall, each of the 250 simulations then comprised a total of ∼3 billion particles.
Selected primary geometallurgical parameters were calculated to summarise the properties of the simulated particle populations: (1) modal mineralogy; (2) particle size distribution, defined by the p50, p90 and log standard deviation of ECD; (3) surface liberation of sulphide minerals, defined by the frequency of the <20%, 20%–40%, 40%–60% and >60% liberation bins; and (4) mineral grain size distribution, defined by the p50, p90 and log standard deviation of the ECD of sulphide mineral grains. The particle and grain size parameters were calculated by numeric frequency rather than by mass, to maintain consistency with the particle binning method.
Validation of the Entire Modelling Workflow
Throughout the individual steps of the workflow (Figure 2), errors are propagated and accumulated. Therefore, it was necessary to evaluate the performance of the entire particle-based modelling workflow. To achieve this, particle properties of the original “observed” sample particle datasets and simulated “predicted” particle datasets were compared. These two datasets are described in the following:
• “Observed” Bootstrap resampling was performed using the original particle datasets for the 36 samples, to obtain simulations of the “observed” particle population. A total of 200,000 particles (N) were sampled 250 times (M) with replacement, i.e., the same parameters as used to reconstruct the particle populations in the model (described in Reconstructing the Particle Populations Using Bootstrap Resampling). Multiple bootstrap sampling simulations were produced to assess uncertainties on the particle population properties for each of the 36 samples.
• “Predicted” To obtain the particle populations representative of the modelling process it was necessary to account for the binning of the particles, the geostatistical modelling of the particle bin frequencies and the bootstrap resampling stages. To do so, the particle bin frequencies generated by the leave-one-out cross-validation of the geostatistical modelling (described in Geostatistical Modelling of Chemistry and Particle Bin Frequencies) were used for bootstrap resampling from the particle bins. The same bootstrap resampling parameters were used as for the “observed” datasets: a total of 200,000 particles were sampled 250 times (M) with replacement for each of the 36 predictions. The number of particles (N) to be selected for each particle bin was determined by multiplying the particle bin frequencies predicted by leave-one-out cross-validation with the total number of particles required (200,000).
The mineralogical and textural properties of interest, mineralogy, particle size, sulphide mineral surface liberation and grain size parameters, were calculated for the “observed” and “predicted” particle populations for each of the 250 simulations of the 36 individual samples. The median values of all properties for each sample were then compared to evaluate how accurately the particle properties were replicated. The measures used included: mean absolute percentage error (MAPE), relative standard deviation (RSD), observed-predicted R2 (Obs-Pred R2).
Testing Potential Applications of Particle Models
The aim of building particle-based geometallurgical models should first be to establish an accurate model of primary geometallurgical properties, such as mineralogy and particle size. Once the model is validated in this way, the modelling can be extended for the assessment of secondary properties. To this end, two applications were tested using the simulated particle data: a bulk sulphide flotation process and an estimation of acid mine drainage potential. The methods used for these two applications are summarised in the following sub-sections.
Process Modelling
Research by Pereira et al. (2021b) has demonstrated that mineral processing operations can be simulated using particle data, clearly showing the potential applications of particle data within this field. According to the method of Pereira et al. (2021b), processing test work should be performed. Automated mineralogy measurements of the feed, concentrate and tailings from test work allow probabilities of recovery to be estimated according to the particle properties of each stream. Although this would have been an ideal approach for this study, processing test work was outside of the scope of this study.
Instead, a simple bulk sulphide flotation process was simulated to investigate the recoverability of the sulphide minerals, pyrite, sphalerite, chalcopyrite, galena, and arsenopyrite. Theoretical probabilities of recovery were defined for individual sulphide-bearing particles based on the particle properties that most strongly control their recovery during flotation: particle size and surface liberation. The degree of liberation corresponds to the surface area of the mineral available to attach to a bubble during flotation and as such, the probability of recovery increases with liberation. The probability of recovery depending on liberation,
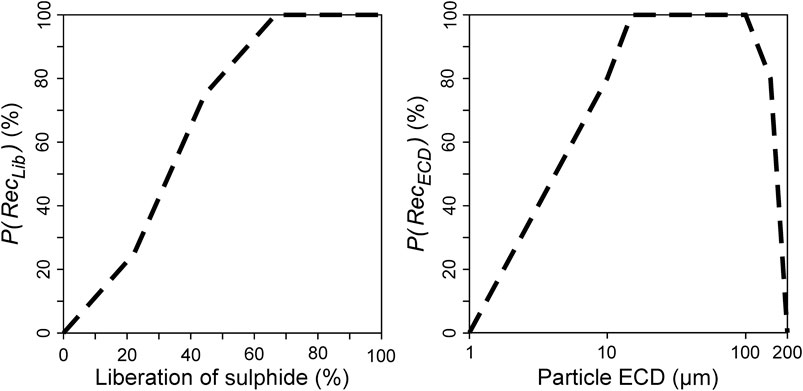
Figure 4. Models for the recovery probability of sulphide-containing particles based on sulphide liberation (
The overall probability of recovery,
The probability of recovery for each sulphide-bearing particle was used to randomly generate a yes/no decision as to whether the given particle would be recovered. This was repeated for each sulphide-bearing particle in each of the 250 simulations of particle data. The “recoverable” sulphide mineral contents were calculated for each simulation from the particles with a “yes” decision for recovery. “Recoverable” is here defined as having a reasonable probability to be recovered during froth flotation, based on particle size and surface liberation properties.
Estimation of Acid Mine Drainage Potential
The information provided from particle data can also be used to investigate environmental behaviour of the tailings. Acid mine drainage (AMD) reactions occur when the sulphides are oxidised, releasing acid, and mobilising toxic elements (e.g., Dold, 2014; Elghali et al., 2023; Simate and Ndlovu, 2014). The computed acid rock drainage (CARD) method developed by Parbhakar-Fox et al. (2016) allows the CARD risk ratio to be calculated to estimate potential for AMD. Firstly, a CARD value is calculated for each sulphide and carbonate mineral present, as shown in Equations 3, 4:
where A is the area of the mineral from the automated mineralogy measurements. The CARD relative reactivity represents the rate at which the mineral will react, based on paste pH values (Noble et al., 2015) and normalised according to Parbhakar-Fox et al. (2016). The CARD acid producing (AP) or neutralising (NP) values were obtained from the mineral stoichiometry or experimental data (Jambor et al., 2007; Lawrence and Wang, 1996; Parbhakar-Fox et al., 2016). For further details on these calculations, and the CARD relative reactivity, AP and NP values for the relevant minerals, readers are referred to the Supplementary Material. The CARD risk ratio was subsequently calculated as ratio of the sum of the CARD values of the carbonate and sulphide minerals (Equation 5).
Using this approach, the AMD potential was estimated from the particle data at all grid points for each of the 250 simulations to assess spatial variability. The “total” CARD value for the entire TSF was also calculated by first summing the areas of the sulphide and carbonate minerals from all grid points before completing the calculations. This was necessary because the CARD risk ratio cannot be expected to be additive and therefore cannot be averaged linearly.
Results
The following subsections summarise the results from the MLA measurements and the geostatistical modelling of chemistry and particle bin frequencies. Following this, the validation results of the particle-based modelling workflow are provided, and the spatial variations of the mineralogy and textural properties of the tailings from the particle-based models are presented. Finally, the results from the bulk flotation simulations and AMD potential estimation are reported.
Mineralogy and Textural Properties of Tailings Samples
Being the basis of the particle modelling, the MLA results will first be presented. The quality of the MLA data and the EPMA measurement results for the sulphide minerals are presented in the Supplementary Material. The mineralogy and textural properties of the original tailings samples were investigated using the “observed” simulations obtained from bootstrap resampling of the MLA particle data for the individual samples, as detailed in Validation of the Entire Modelling Workflow. The summary statistics per sample of all relevant particle properties are provided in Supplementary Table S8.
The mineralogy and particle size distributions of selected samples, taken to represent different portions of the tailings dam, are plotted in Figure 5, alongside the results from the dataset of all particles for comparison. The mineralogy (Figure 5A) of the selected samples is dominated by silicate minerals (range: 34.3–66.3 wt. %, median: 46.0 wt. %) and sheet silicate minerals (range: 25.1–49.3 wt. %, median: 37.6 wt. %). The carbonate minerals are present at median contents of up to 1.0 wt. % each, while the “Fe-oxide and Fe-carbonate minerals” group is present at contents of around 2.4 wt. %. Pyrite has a significantly higher content (∼4.0 wt. %) than arsenopyrite (∼0.59 wt. %), sphalerite (∼0.32 wt. %), chalcopyrite, and galena (∼0.04–0.05 wt. %) (Figure 5B).
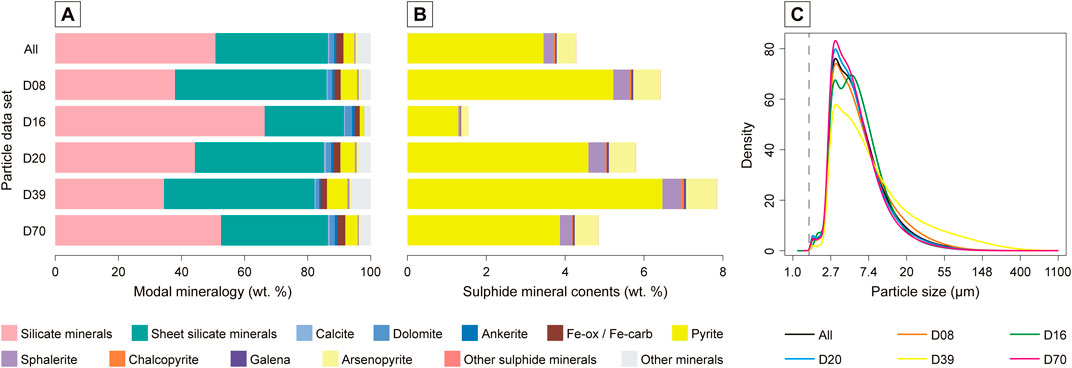
Figure 5. (A) Bar charts of modal mineralogy and (B) sulphide mineral contents (C) kernel density plots of observed particle size distributions (C) for selected samples from across the tailings deposit, illustrating the differences in mineralogy and particle sizes for different samples. The combined dataset of all particles is also plotted. The vertical dashed line in (C) corresponds to the resolution of the MLA measurements at 1.5 µm.
The p50 of the particle size distributions of the samples varies from ∼4.4 to 6.8 µm, with a median value of ∼5.0 µm, showing that there is a large abundance of clay to fine silt grade particles in the tailings. The p90s of the particle size distributions vary more significantly, from ∼9.7 to 39.9 µm, with a median value of 12.8 µm, corresponding to fine to coarse silt grade (Supplementary Table S8). The particle size distributions peak at similar particle sizes (Figure 5C), but the frequencies differ and form smooth, positively skewed distributions. To some extent, the degree of skewing might be an artefact of the MLA measurements, which had a resolution of 1.5 µm in this case. The particle size distributions per mineral group, from the combined dataset of all particles, are also shown in Figure 6. The liberated mineral groups have peaks at around 3–7 μm, while the mixed particle groups have coarser particle sizes and broader distributions. The “fully liberated sulphide particles” group has the finest particle sizes, while the “mixed particles containing sulphide” group has the highest frequencies of coarser particle sizes (Figure 6).
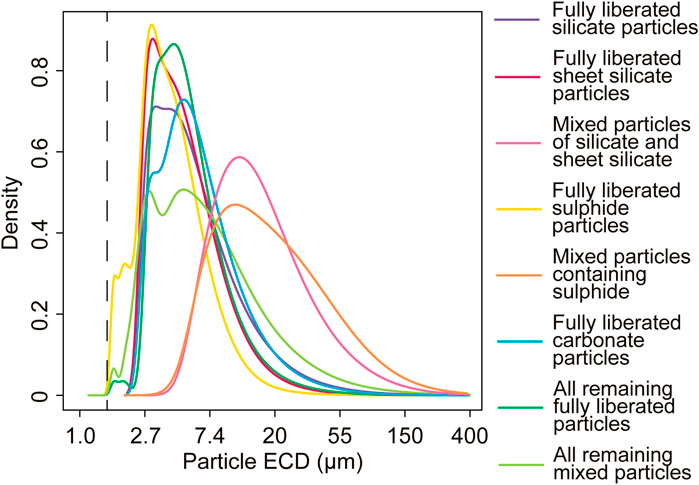
Figure 6. Kernel density plots of the particle size (ECD) of each mineral grouping for particle binning. The vertical dashed line corresponds to the resolution of the MLA measurements at 1.5 µm.
The grain size distributions of the sulphide minerals from the combined dataset of all particles are plotted in Figure 7, demonstrating that the sulphide minerals are fine-grained. The p50 and p90 values for the sulphide minerals are provided in Supplementary Table S8 and do not vary greatly between the samples. Pyrite has the coarsest size distribution of the sulphides, with a broad peak at around 2–7 µm and a wider distribution. Sphalerite, chalcopyrite, galena, and arsenopyrite have finer distributions, with a higher abundance of fine grains of ∼2 µm and a smaller peak at ∼5 µm (Figure 7).
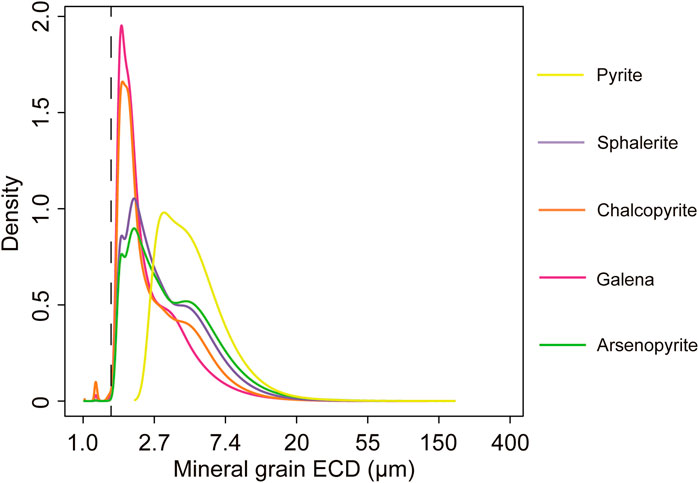
Figure 7. Kernel density plots of the grain sizes (ECD) of pyrite, sphalerite, chalcopyrite, galena and arsenopyrite in the composite of all samples. The vertical dashed line corresponds to the resolution of the MLA measurements at 1.5 µm.
The surface liberation of the sulphide minerals in each sample was investigated using the particle frequencies of four surface liberation classes: <20%, 20%–40%, 40%–60%, and >60% liberated (Supplementary Table S8). The sulphide mineral grains are well liberated, particularly those of pyrite, with 85%–97% in the >60% surface liberation class. Arsenopyrite and sphalerite show similar degrees of surface liberation (around 66%–98% of all particles have >60% surface liberation), while chalcopyrite and galena exhibit more variable degrees of surface liberation (around 30%–95% of all particles at >60% surface liberation). The complexity of the distributions of the degree of surface liberation of the sulphide minerals is confirmed by the histograms in Figure 8, showing the degree of surface liberation of all sulphide grains from the combined particle dataset of all samples. There is a large peak at 100% surface liberation for all sulphide minerals and a smaller peak at 0% surface liberation, which is largest for chalcopyrite and galena.
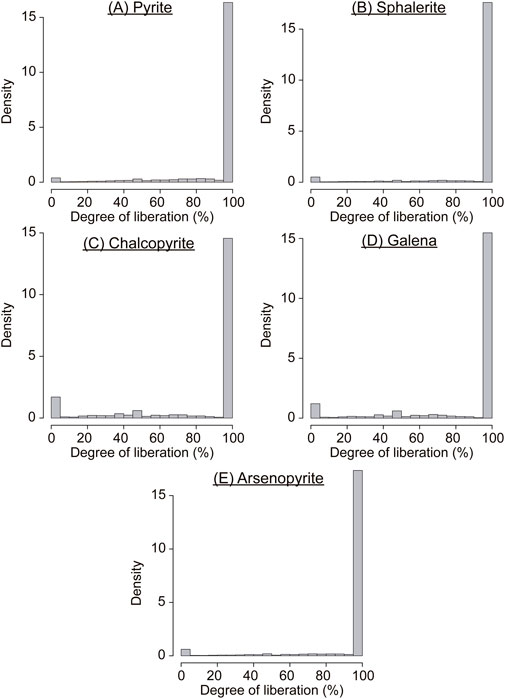
Figure 8. Histograms of the degree of surface liberation of the sulphide mineral grains (A) pyrite, (B) sphalerite, (C) chalcopyrite, (D) galena, and (E) arsenopyrite, obtained from the particle data from all samples.
Geostatistical Modelling Results
The geostatistical modelling results for the chemistry are similar to those of Blannin et al. (2022b). For brevity, these results are presented in the Supplementary Material. The geostatistical modelling results for the particle bin frequencies are summarised herein, and further detailed in the Supplementary Material. The selected trends for each clr variable are shown in Supplementary Table S12, where a variety of the MAF coefficients are seen to be selected for individual clr variables, plus gst. The variogram model and local neighbourhood parameters are provided in Supplementary Table S13.
The leave-one-out cross-validation results for the geostatistical modelling of particle bin frequencies are presented in Supplementary Table S14. Around half of the Obs-Pred R2 values for the particle bin frequency predictions are >60% and a third are >70%. Bar graphs of the Obs-Pred R2 values for the particle bins are provided in Figure 9 to illustrate the variability in the predictions. The particle bin frequencies that are best estimated correspond to: (1) all or most of the fully liberated “silicate minerals,” “sheet silicate minerals” and “sulphide minerals” bins; (2) the finer- and coarser-grained “mixed particles containing sulphide minerals” bins; (3) the coarser-grained “carbonate minerals,” “mixed particles of silicate and sheet silicate minerals,” “all remaining fully liberated particles” and “all remaining mixed particles” bins.
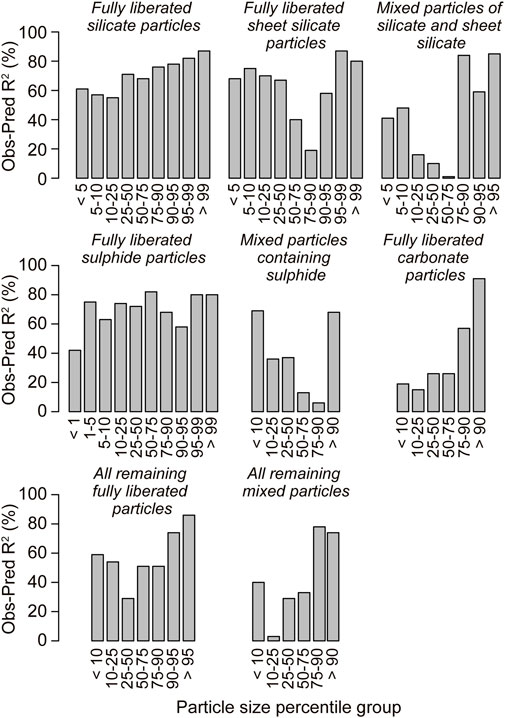
Figure 9. Bar plots of Obs-Pred R2 values for individual particle bins from the leave-one-out cross-validation of the geostatistical modelling.
The mixed particle group bin frequencies were generally poorly predicted (Figure 9). The Obs-Pred R2 values typically range from 1% to 40% for these bins, showing little to no correlation between the observed and predicted values. The mineralogical compositions of the mixed particle groups are more variable and therefore correlate less strongly with the chemistry, leading to poorer prediction of these particle bins. The fine-to medium-grained “carbonate minerals” bins were also poorly predicted with Obs-Pred R2 values of 15%–26% (Supplementary Table S14). The Pred-Res R2 values are also variable, ranging from 0 up to 39%. However, the Pred-Res R2 values are predominantly less than 20%, and well over half (60%) are lower than 10%, demonstrating that the predictions are mostly unbiased. This is corroborated by the ME and RSR values, which are all close to zero (Supplementary Table S14).
Validation of Particle-Based Modelling Workflow
To validate the entire particle-based modelling workflow, particle properties from the “observed” and “predicted” particle datasets (see Validation of The Entire Modelling Workflow for details), were compared to evaluate how well they were reproduced by the model. The results for the modal mineralogy and particle size properties of the samples are provided in Table 1 while the results for the remaining properties can be found in Supplementary Table S15. Additionally, scatter plots of the “observed” and “predicted” particle properties per sample, with uncertainties, are displayed in (Figure 10; Supplementary Figure S3). Overall, the results show that most of the material properties could be predicted with high accuracy, which is an excellent result given the complexity of the interpolation of particle populations.
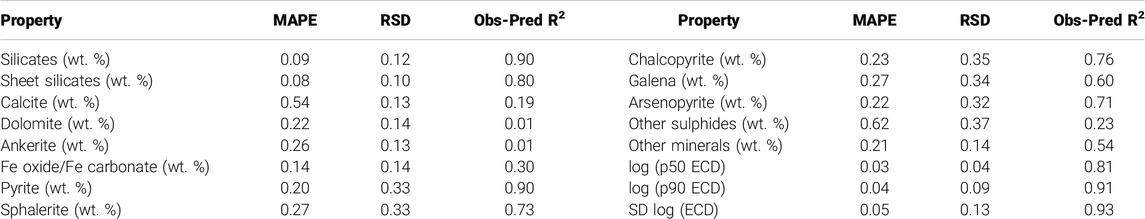
Table 1. Validation results for selected particle properties, including mineral contents and particle size distribution measures from the particle-based geostatistical modelling. SD, standard deviation.
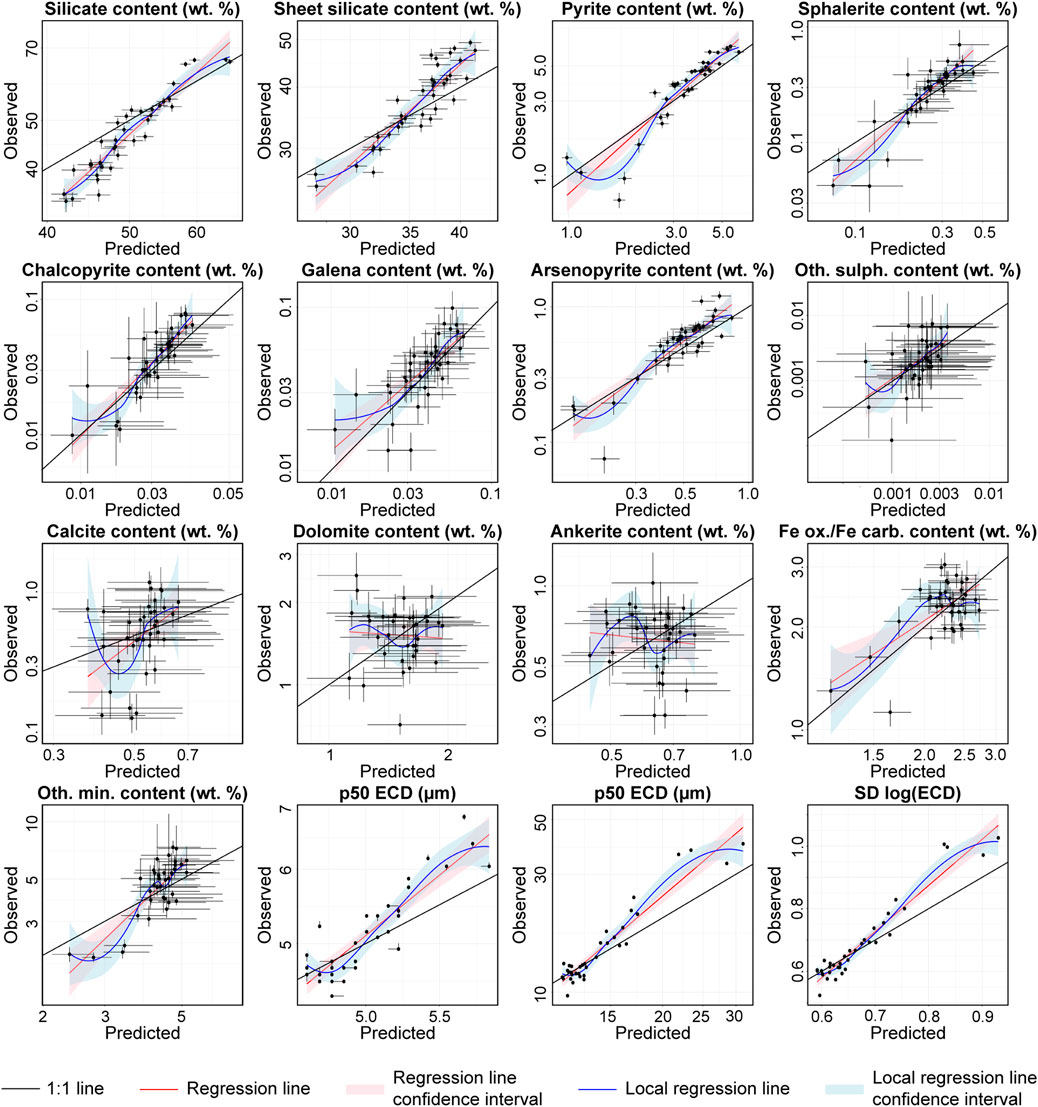
Figure 10. Scatter plots of the validation results for the particle-based geostatistical modelling for modal mineralogy and particle-size (ECD) distribution parameters. The 95% confidence intervals are determined by a combination of geostatistical simulation and bootstrap resampling, as described in the methods section. The 1:1 line, a regression line and a local regression curve are plotted to show the average deviations of the estimated properties from the observed properties.
The contents of the major mineral groups are very well predicted, with Obs-Pred R2 values for the silicate minerals and sheet silicate minerals of 90% and 80%, respectively, and low MAPE and RSD values, indicating high accuracy (Table 1). As seen in Figure 10, the small values are somewhat under-estimated and the large values over-estimated, which is a typical effect of interpolation. The sulphide minerals are also well predicted: pyrite has the highest Obs-Pred R2 of 90%, followed by 60%–76% for galena, arsenopyrite, sphalerite and chalcopyrite. The carbonate minerals, “other sulphide minerals” and “Fe-oxide and Fe-carbonate group” contents are not as well predicted, with Obs-Pred R2 values of 1%–30%. In fact, the carbonate mineral estimates essentially consist of noise around the average.
The predictions of the particle size distribution measures, p50, p90 and standard deviation, are excellent, with Obs-Pred R2 values of 81%–93% and low MAPE and RSD values, between 4% and 12%. However, the coarser particle sizes are somewhat under-estimated (Figure 10). For the sulphide mineral grain size parameters, the best results were achieved for pyrite (Obs-Pred R2 64%–84%), arsenopyrite (Obs-Pred R2 55%–80%), as well as log (p90) of sphalerite, standard deviations of sphalerite and chalcopyrite grain size (Obs-Pred R2 69%–81%). The remaining sulphide mineral grain parameters were less well predicted, with Obs-Pred R2 values of 20%–51% (Supplementary Table S15) and large confidence intervals (Supplementary Figure S3). Despite this, the MAPE and RSD values are low for all sulphide mineral grain-size parameters, from 2% to 10%.
On average, the predictions of the surface liberation class abundances are correct, with the regression lines coinciding with the 1:1 line within error for all classes (Supplementary Figure S3). In contrast, the Obs-Pred R2 values are low for most of the sulphide mineral liberation classes, with around half being less than 50% (Supplementary Table S15). It is clear from Figure 8 that the bulk of the sulphide mineral grains are in the >60% surface liberation class and the best predictions were achieved for >60% surface liberation classes of sphalerite, chalcopyrite, galena and arsenopyrite, with Obs-Pred R2 values of 58%–72%, demonstrating that the results are reasonably good overall. However, the surface liberation class abundances for pyrite are poorly predicted, with Obs-Pred R2 values of 11%–21% and large amounts of scatter observed in the predictions.
Spatial Variability of Mineralogy and Textural Properties of the Tailings
The spatial distribution of the mineralogical and textural properties within the tailings deposit are significant for understanding which zones may have greater resource potential or pose an environmental threat. As an example, maps of the p50, p90, and standard deviation of the particle size were plotted to investigate their predicted spatial variability, including 3 simulation examples and an average of the 250 simulations (Figure 11). It is apparent that particle size decreases and becomes less variable away from the dam walls and spill points. The simulations are “noisy” and reach more extreme values (both small and large) than the “smoothed” average map. This highlights the importance of producing multiple simulations, to provide an idea of the uncertainty of the predictions. To illustrate how the simulations differ from reality, the circles on the maps plot the “observed” values from the original samples. For the particle size measures, the simulated values are very close to reality, particularly in the average map.
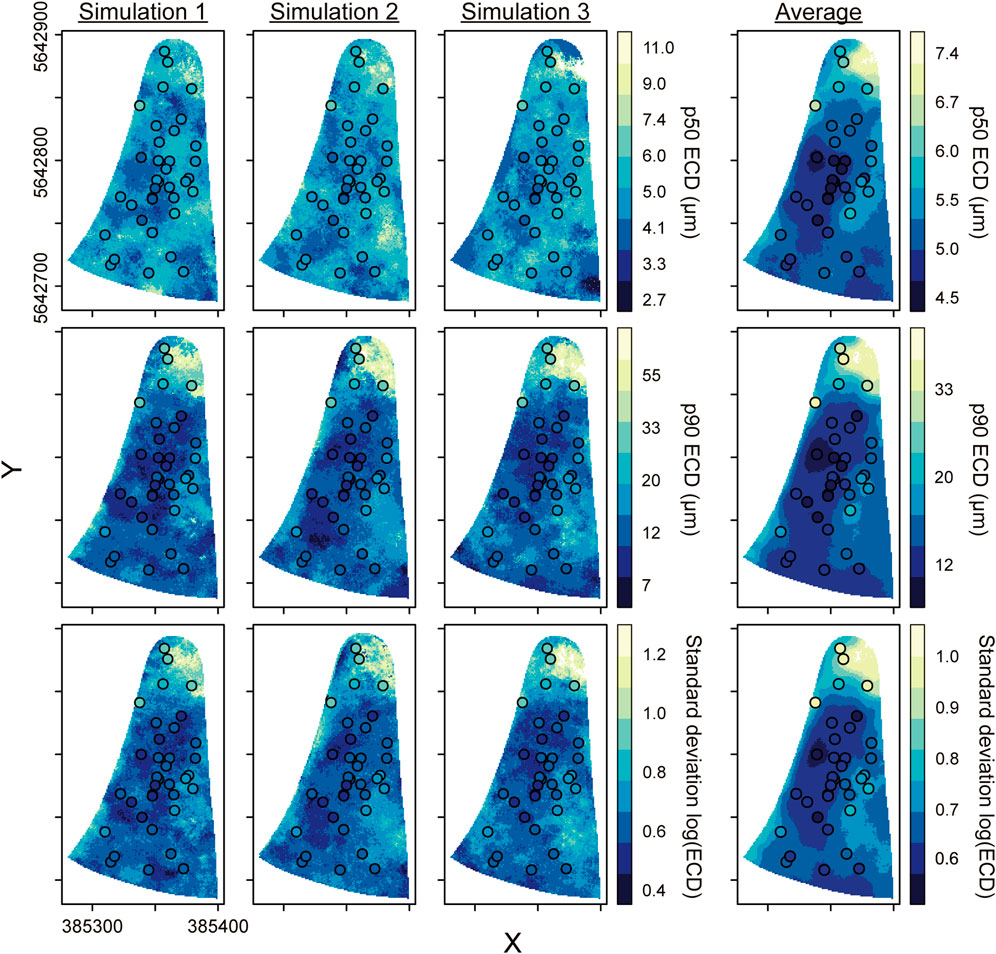
Figure 11. Spatial maps of the particle size parameters of the ECD, including p50, p90 and standard deviation of log (ECD). The maps are plotted for three simulations as examples and the average of the 250 simulations. The circle points are the “observed” data from the original samples.
The average maps of further properties are provided in Figure 12, including the contents of the silicate minerals, sheet silicate minerals, dolomite, pyrite and sphalerite, as well as the sphalerite grain size and surface liberation parameters as examples of the textural properties of the sulphide minerals, which follow the same trends. Maps of simulation examples for these properties and others are provided in Supplementary Figures S4–S7. The silicate mineral content is higher around the dam walls and decreases towards the centre, while the sheet silicate minerals content follows the opposite trend. The carbonate mineral simulations are mostly noise, with large differences to the “observed” values, but a slight increase in carbonate content away from the dam walls is noticeable.
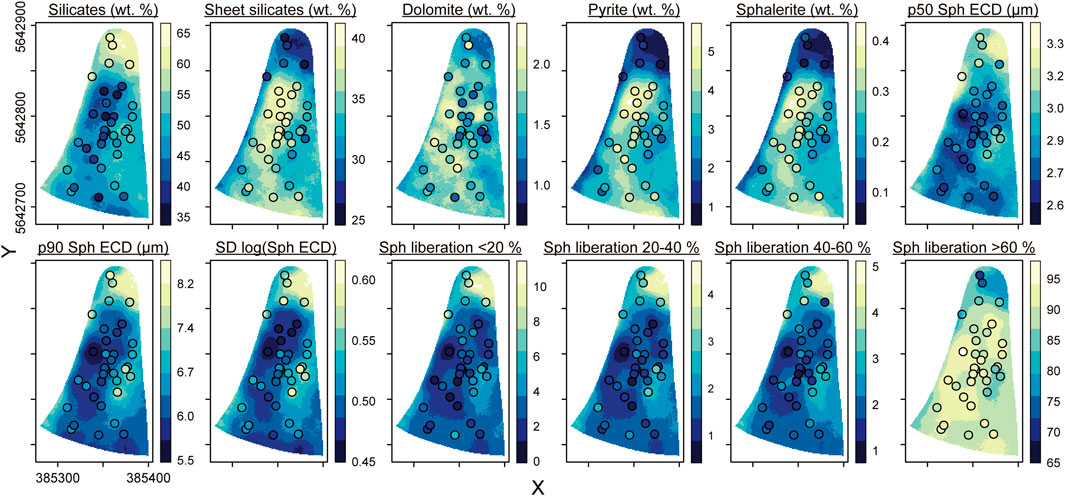
Figure 12. Spatial maps of the contents of silicate and sheet silicate minerals, dolomite, pyrite and sphalerite, as well as the grain size and surface liberation parameters of sphalerite. The maps are plotted for the average of the 250 simulations and the points are the “observed” data from the original samples. SD, standard deviation.
The sulphide minerals become more abundant towards the centre of the deposit, agreeing with the findings of Blannin et al. (2023, 2022b) that the sulphide-hosted metals Cu, Zn, Pb, As, Cd, and In were most enriched in the this zone. The individual simulation realisations of the sphalerite grain size and surface liberation parameters are rather noisy and generally vary from the “observed” values as a result of the larger uncertainties in the predictions. However, on average, these predictions are closer to reality and the sphalerite grain size p90 and standard deviation decrease away from the dam walls, while this trend is less apparent for the p50. The frequency of the >60% sphalerite surface liberation class is significantly higher than the other classes and increases towards the centre of the tailings deposit, in contrast to the <20%, 20%–40% and 40%–60% classes which are most abundant around the dam walls. In summary, the abundance of fine-grained and well-liberated sulphide mineral grains increases towards the centre of the TSF (Figure 12).
Potential Applications of Particle Models
The aim of building particle-based geometallurgical models should be to enable further geometallurgical modelling of mining and processing behaviour, as well as to investigate other relevant material properties of the tailings, such as environmental parameters. Two applications of the particle model were tested to assess the utility of the particle data for process modelling and environmental assessment and these results are reviewed in the following.
Resource Potential and Process Modelling
For tailings valorisation, it is important to understand which processing methods are applicable for the recovery of valuable and critical metals from the tailings. As previously stated, flotation test work was outside the scope of this study. Instead, a simple bulk sulphide flotation process was simulated using the particle data, assigning probabilities of recovery to sulphide-bearing particles based on sulphide surface liberation and particle size. This process intended to investigate the “recoverability” of the sulphide minerals with flotation, inform on potential processing routes and highlight the value of particle data for such purposes.
The results of the flotation simulations are shown in Table 2. The predicted “in-situ” contents of the sulphide minerals are low (medians of 0.03–0.49 wt. %), with the exception of pyrite, with an average of 3.3 ± 0.3 wt. %. According to the process simulations, the recoverable portions vary from around 45% of the content for galena and chalcopyrite and up to 66% for arsenopyrite. The total sulphide mineral content has a median of 4.13 wt. %, of which 58% is estimated to be recoverable by flotation. To investigate any spatial dependence of the sulphide mineral recoverability, maps of the total sulphide content, both “in-situ” and recoverable were plotted, as well as the proportion of recoverability (Figure 13). The proportion of recoverable sulphide minerals decreases towards the centre the TSF, demonstrating that the well-liberated sulphide grains are likely too fine to be recoverable with froth flotation.
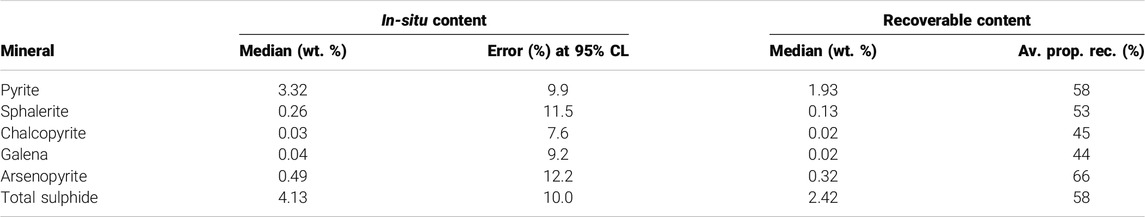
Table 2. Summary statistics from the 250 simulations for the mean sulphide mineral and total sulphide mineral contents of the whole TSF, as well as the recoverable sulphide mineral contents and the average proportion of recoverability (Av. Prop. rec.) from the flotation process simulations. CL, confidence level.
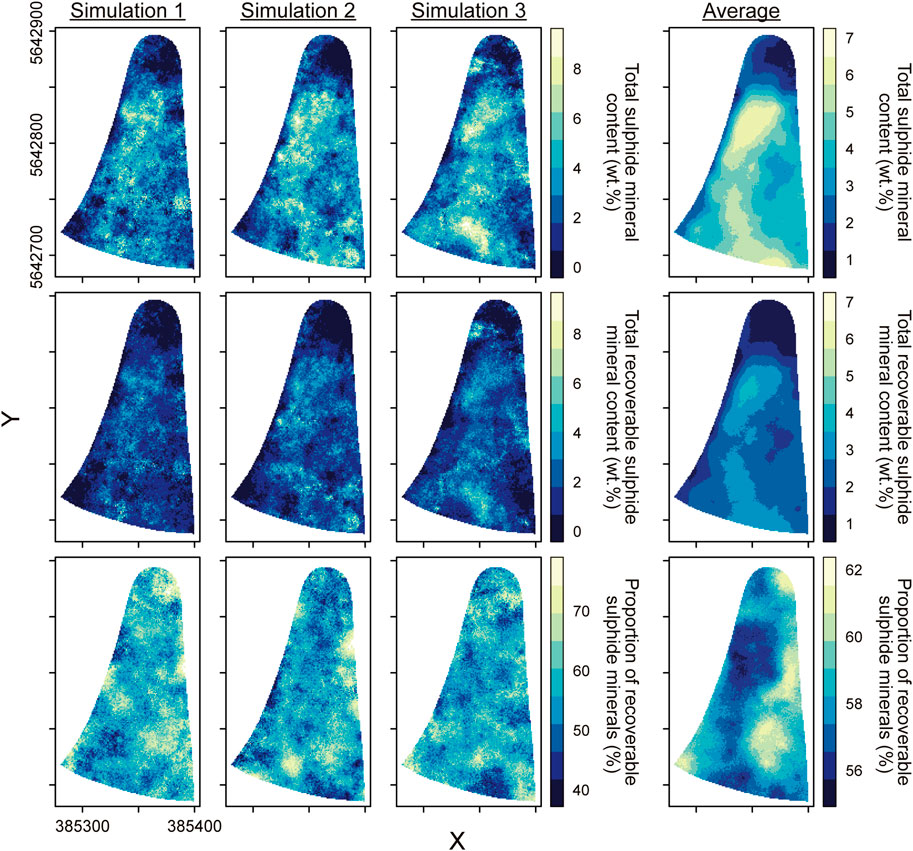
Figure 13. Spatial maps of the total sulphide mineral content, recoverable sulphide mineral content, and proportion of recoverable sulphide mineral content. The maps are plotted for three simulations as examples and the average of the 250 simulations. The circle points are the “observed” data from the original samples.
Acid Mine Drainage Potential
The potential for AMD generation from the tailings was estimated based on the contents of sulphide and carbonate minerals, combined with their reactivities and acid-generating or -neutralising values. The CARD risk ratio is defined as the ratio between the calculated acid-generating and -neutralising potentials (Parbhakar-Fox et al., 2016).
The summary statistics from the 250 simulations of the “total” CARD risk ratio, calculated for the whole tailings, are given in Table 3. With a certainty of 95%, the “total” CARD risk ratio lies between 0.43 (high risk) and 1.27 (potential risk). The median “total” CARD risk ratio is 0.72, which is defined as moderate risk (Parbhakar-Fox et al., 2016). AMD potential is fairly constant within most of the tailings material, with medium to extremely high CARD risk ratings (Figure 14). The tailings materials in the north of the deposit and nearer the dam walls have lower CARD risk ratios (moderate or probable risk), coinciding with lower sulphide mineral contents. Although the carbonate contents were generally not well predicted and likely increase the variability in the CARD risk ratio estimates, the “total” CARD risk ratio should be well constrained on average, and its variability accounted for by the simulations.

Table 3. Summary statistics of the total CARD risk ratio estimates for the whole TSF from the 250 simulations.
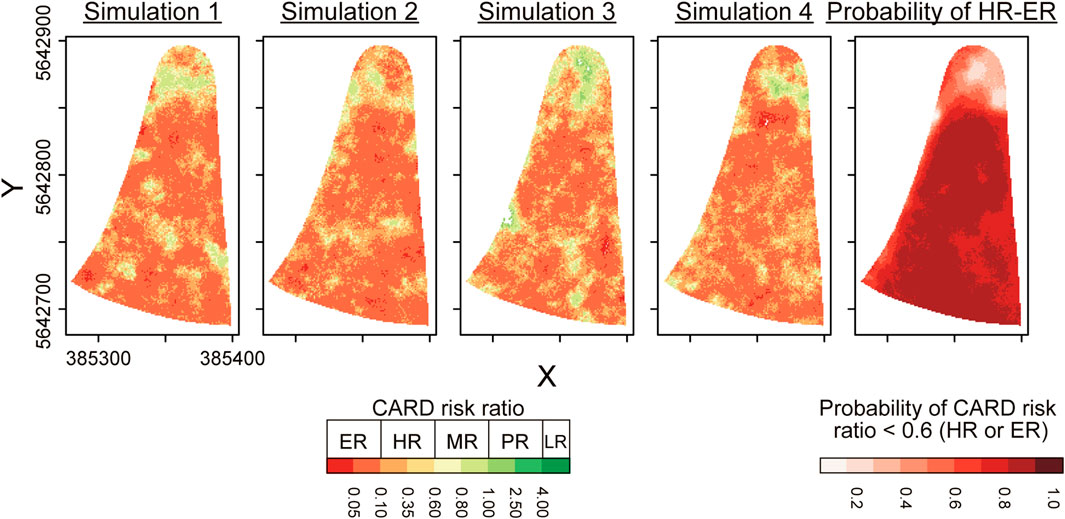
Figure 14. Spatial maps of the CARD risk ratio estimated from the sulphide and carbonate mineral areas, for a random selection of simulation realisations to illustrate how the CARD risk ratio varies across the TSF and between simulations. ER, extreme risk; HR, high risk; MR, moderate risk; PR, potential risk; LR, low risk. On the right, the probability of the CARD risk ratio being <0.6, i.e., ER or HR, calculated from the 250 simulations, is also plotted.
Discussion
In the following subsections, the accuracy of the results is discussed, with a particular focus on its link to the sedimentary-style deposition of the tailings. Secondly, the applications of the particle data are discussed, with a focus on processing and environmental behaviour of the tailings. Lastly, the limitations of the applied method are considered, as well as opportunities for further development.
Quality of Modelling Results and the Link to Sedimentary-Style Deposition
The unique combination of methods for the geometallurgical modelling of tailings deposits developed in this work has proved capable of accurately modelling the particle sizes and the bulk mineral contents of major mineral groups and the sulphide minerals. The sulphide mineral surface liberation and grain size parameters were reasonably well to well reproduced in most cases. In contrast, the contents of other minor mineral groups were not as well constrained. The reasons for these apparent variations in the quality of the results will be discussed in the following.
The distribution of particle types within a TSF is controlled by the sedimentation processes occurring during tailings deposition. Particle size and density, which are closely linked to mineralogy, are the dominant controls on particle sorting. Coarser and denser particles are deposited proximal to spill points and finer, less dense particles travel further into the centre of the TSF. The location of a past spill point is highlighted in Figure 1B, where a depositional fan can be seen. This effect is confirmed by the particle size p90s, which decrease away from the dam walls (Figure 11). The excellent prediction of particle sizes and bulk mineralogy is attributed to the systematic variations in the frequency of different particle types across the tailings deposit that results from the sedimentation processes. As a result of this, the modelling workflow developed here may not be as successful for TSFs where sedimentary-style deposition of the tailings has not occurred, e.g., dry stack (thickened) tailings.
Conversely, the grain sizes and degree of surface liberation of the sulphide minerals are not primary controls on the sedimentation of particles, and therefore, may not be expected to exhibit a systematic trend across the tailings deposit. However, the froth flotation process rejects coarse, intergrown particles and fine, liberated particles. Mineral grain size is equivalent or similar to particle size when the mineral is fully or highly liberated and therefore mineral grain size and surface liberation will correlate with particle size to some degree. A particle containing a well-liberated sulphide grain will usually be mainly comprised of the sulphide mineral and as a result, surface liberation will also be related to mineralogy. Consequently, grain size and surface liberation of the sulphide minerals can be expected to be somewhat linked to the sedimentary-style depositional processes.
This helps to explain how the sulphide grain size and surface liberation properties could be reasonably well predicted in some cases, although with large uncertainties. The high uncertainty of these predictions is in fact expected for properties of minerals present at minor and trace abundances (e.g., Bevandić et al., 2022; Blannin et al., 2021). In addition, a grid pattern in the sulphide mineral p50 predictions (Supplementary Figure S3) reduces the quality of the predictions and is an artefact from the pixel size of the MLA measurements and the high number of fine grains comprising only one, or a small number, of pixels. However, the main cause of the poorer prediction of the surface liberation class frequencies is that the majority of the “mixed particles containing sulphide minerals” bin frequencies were poorly constrained, with Obs-Pred R2 values of 6%–36% (Supplementary Table S14). This is caused by the complex nature of these particles, which may be associated with different minerals in different proportions, producing variable behaviours in the sedimentation process throughout the TSF. Despite this, the majority of the sulphide mineral grains are in the “fully liberated sulphide particles” bins (Figure 8), which were well predicted (Obs-Pred R2 values ∼60–80%). As a result, grain size and surface liberation can be assumed to be reasonably well constrained on average.
Of all the minerals/mineral groups investigated, the carbonate mineral contents were most poorly estimated, with no clear spatial trends across the TSF and the predictions being mostly noise around the mean (Table 1; Figure 10; Supplementary Figure S7). This is attributed to poor prediction of the majority of the carbonate group bin frequencies (Supplementary Table S14). The carbonate mineral contents could be expected to correlate with the CaO content. However, the CaO content was relatively poorly predicted by the geostatistical modelling with an Obs-Pred R2 of 55% (Supplementary Table S11), and does not exhibit a clear trend across the deposit (Blannin et al., 2023). This is likely related to the fact that Ca occurs in multiple minerals, including feldspars, amphibole, gypsum, and fluorite, which are variably present across the TSF. It is also possible that the carbonate minerals were not well sorted during the deposition of the tailings. Overall, the chemical elements used here cannot be considered a good predictor of the carbonate contents. The inclusion of more elements which comprise the minerals of interest, such as carbon for carbonates, could help to improve the results for some mineral species but would also require further geochemical analyses.
The error bars on the carbonate mineral contents are of the same order of magnitude as the spread of the data, as seen in Figure 10, implying that the observed variance and resampling error are comparable. To test this hypothesis, it is assumed that the variogram nugget is the sum of analytical error plus microscale variability. The component of analytical error can be quantified as the width of the confidence interval of the bootstrap resampling simulations. A nugget larger than the analytical error would indicate the presence of “microscale variability,” i.e., variogram structures with ranges smaller than the shortest distance between the samples. Further sampling and data acquisition would be required to capture these microstructures and improve the modelling results. If the nugget and analytical error are similar, it can be assumed that much of the observable variability is due to analytical uncertainty, which cannot be reduced and as such, the geostatistical modelling results could not be improved by further data or more complex modelling.
Following this approach, variograms were computed for the properties that were most poorly predicted (carbonate mineral contents and pyrite surface liberation class abundances) as well as selected properties that were well predicted (silicates, sheet silicates and pyrite contents) for comparison. Variogram models were fitted (Supplementary Table S16; Supplementary Figure S8) and the nugget was converted to a “spread” measure according to Equation 6:
The 95% confidence intervals, which correspond to ± 2σ and are therefore analogous to the “spread” measure, were calculated using the 250 “observed” bootstrap resampling simulations. The results are provided in Table 4, where it can be seen that the “spread” and confidence interval of the sheet silicate, calcite, dolomite, and ankerite contents are almost equal. The same can be said for the <20% and 20%–40% surface liberation classes of pyrite. It follows that the prediction of the sheet silicate and carbonate mineral contents and poorly liberated pyrite class frequencies could not be improved with the currently available samples and data since they are mostly due to analytical uncertainties. In contrast, the confidence intervals of the silicates and pyrite content, and the 40%–60% and >60% surface liberation classes of pyrite are significantly greater than the “spread.” This may imply that the nugget components of the variograms of the associated particle bins were under-estimated during variogram fitting, which aimed to select to most parsimonious trend-variogram model for each particle bin.
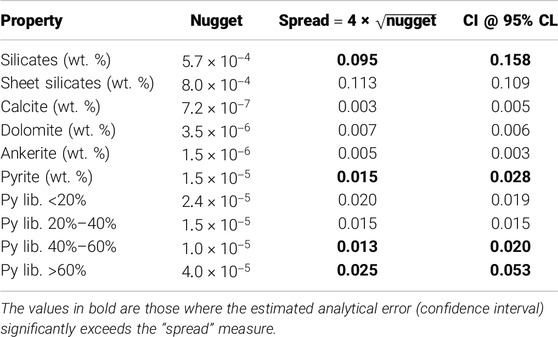
Table 4. The nuggets of fitted variogram models of the silicates, sheet silicates, carbonate mineral and pyrite contents, and pyrite surface liberation (Py lib.) classes , alongside the corresponding “spread” measures. These values were compared to the confidence interval (CI) at 95% confidence level (CL) of the given particle property from the 250 bootstrap simulations.
Particle Models: Implications for Resource Potential and Environmental Behaviour
Two potential applications of the particle-based models have been shown to produce valuable results considering the processing and geoenvironmental characteristics of the tailings. In the following section, the implications of the findings of this study for the resource potential and environmental behaviour of the tailings deposit will be discussed.
In the Davidschacht TSF, the elements of interest are concentrated in the sulphide minerals. Therefore, an appropriate processing route may include a stage of froth flotation to recover a sulphide mineral concentrate and a “clean” residue (Babel et al., 2018; Bilal et al., 2022; Manca et al., 2021). The sulphide concentrate could be further processed, likely with leaching (Álvarez et al., 2021; Kamariah et al., 2022; Schueler et al., 2021) or bioleaching (Opara et al., 2022; Ristović et al., 2022; Romero-García et al., 2019) to recover the valuable metals. The “clean” residue could be used in industrial applications (Helser et al., 2022a; Kinnunen et al., 2022; Veiga Simão et al., 2021b). To emphasise the value of particle data for informing on potential processing routes, a simple bulk sulphide flotation process was simulated to investigate the recoverability of sulphide minerals with flotation.
The results of the flotation simulations (Table 2) imply that around 58% of the total sulphide mineral content may be recoverable by flotation. Therefore, approximately 40% of the sulphide-bearing particles would remain in the tailings after flotation. The residual tailings may be amenable for use in geopolymers (Niu et al., 2022), but the high S and heavy metal contents would exceed the requirements for ceramics production (Helser et al., 2022a; Veiga Simão et al., 2021a). Processing test work should be performed to confirm the findings of the flotation simulations, and to determine an alternative approach to both recover the valuable elements and produce a “clean” residue. Fine particle flotation methods could potentially achieve higher recovery rates (e.g., Coelho Braga de Carvalho et al., 2023; Whitworth et al., 2022). Instead, direct leaching or bioleaching may prove more efficient and cost-effective (Mäkinen et al., 2020; Opara et al., 2022; Reynier et al., 2021). Using bioleaching, Martin et al. (2015) achieved recoveries of 81% Zn and 87% In from the Davidschacht tailings. Further method development is needed to enable the recovery of valuable metals such as Cu and Pb, and deleterious elements such as S and As.
The results of the flotation simulations demonstrate what can be achieved with particle data to investigate appropriate processing methods. For the purposes of this work, the simple flotation simulations were sufficient, but to model processes more accurately would require many more parameters and increased complexity. The works of Pereira et al. (2022, 2021b, 2021a) have demonstrated that mineral processing operations can be simulated using particle data from automated mineralogy analyses of products from processing tests. The ultimate goal should be to integrate the spatial particle-based modelling developed in this work with such process models to simulate the processing of the entire deposit. The integrated particle model could be used for optimisation purposes, followed by economic modelling of mining and processing operations for a complete geometallurgical model of all stages of the mining value chain. Tailings deposits would be particularly well-suited to such an approach, because they are already particulate in nature. Primary ore deposits require further mining and processing steps, e.g., blasting, crushing, and milling, for which no sufficiently detailed particle-based models yet exist (Pereira et al., 2023).
Regarding the environmental behaviour of the tailings, the potential for AMD generation was estimated from the particle data using the CARD approach developed by Parbhakar-Fox et al. (2016). The results indicate that the tailings pose a moderate risk for AMD production (Table 3). This implies that the carbonate minerals present, calcite, ankerite and dolomite, are not sufficient to neutralise the high acid-generating potential of the sulphide minerals, particularly pyrite (Jambor et al., 2007; Noble et al., 2015). The potential for remobilisation and leaching of heavy metal(loid)s, including Cd, As and Pb, from the Davidschacht TSF has been established by BIUG (2009) and G.E.O.S. (2012). Furthermore, a recent study by Helser et al. (2022b) determined that the sulphide-associated heavy metal(loid)s in the Davidschacht tailings are highly mobile and bioaccessible and the tailings pose an environmental threat in their natural state, meaning that some remediation may be required.
The CARD method is an elegant technique to rapidly estimate AMD potential based on automated mineralogy measurements rather than time-consuming static testing. However, AMD reactions are also influenced by other material properties, such as the exposure of the sulphide and carbonate minerals to oxygen and water (liberation and grain size), as well as their spatial relations (mineral associations), which are not accounted for in the CARD equations. Additionally, the method is most applicable for un-weathered samples, rather than tailings from historic TSFs which are commonly oxidised to some extent, or fully oxidised in the oxidation zone. When sulphide minerals are depleted, secondary minerals may drive acid production (Elghali et al., 2021), and therefore the CARD risk ratio is likely a conservative estimate of AMD potential.
As described by Parbhakar-Fox and Baumgartner (2023), environmental parameters are becoming increasingly important geometallurgical properties for inferring environmental behaviour of future wastes. For tailings in particular, an understanding of the current and future environmental impacts of the materials is vital. Even when sufficient economic potential cannot be defined, mitigation of environmental risks may drive the need for remediation or remining of a TSF. Particle models provide a good opportunity to further develop methods for predicting environmental behaviour of tailings, such as the CARD method for AMD potential and reactive transport modelling to investigate remobilisation and leaching of heavy metals.
Overall, promising results were achieved with the particle models, and the applications tested proved to be insightful regarding both processing and environment behaviour. In the future, geometallurgical modelling of TSFs should consider not only economic factors but also environmental factors.
Limitations of the Current Method and Opportunities for Further Development
Given the complexity of the problem being tackled in this study, the authors express the opinion that the results of the integrated modelling method presented here provide a good starting point for the spatial interpolation of particle populations. This section discusses the limitations of the current method and the opportunities for further development.
Dealing with the particle data was highly computationally intensive, and as a result, running the codes used a great deal of computational memory and was very time consuming. Each simulation comprised 3 billion particles, which meant that it was impossible to retain the entire population of particles for each simulation, and only certain properties could be extracted (larger than memory problem). The computational limitations also meant that the binning had to be performed on the basis of distributions by number of particles rather than mass, which would be preferable, particularly for, e.g., the binning of the particles by particle size. This was because randomly sampling from multiple particle classes while maintaining the correct mass ratios would require constrained sampling algorithms which, to the authors knowledge, are not yet available for such large amounts of data. To reduce the run-time of the simulations, the options would be to sample fewer particles at each grid point and/or use a larger grid spacing. However, this would increase sampling errors due to the lower particle count, increasing uncertainty in the modelling results, and reduce spatial resolution. Future research will have to weigh-up the desired resolution and the memory/time capacity for running the simulations to optimise the number of simulations, grid points and particles per grid point, especially if the approach is to be extended to 3D modelling.
The exhaustive dataset available for this work, i.e., the historical aerial photograph of the tailings deposit and the chemical data obtained from geostatistical modelling, helped to improve the geostatistical modelling results and therefore the overall workflow. This is due to the link of these data to particle size and mineralogy, and therefore, the sedimentation processes occurring during tailings deposition. A possible advancement to the method would be to incorporate other exhaustive data which correlate well with different material properties to improve the predictability of properties not related to particle size. If extending the method to a 3D system, exhaustive data such as geophysical surveys may help to resolve the particle populations occurring at depth. In such cases, historical images could only be used if taken at regular time and/or space intervals as the TSF has been filled, allowing for good spatial coverage and accurate correlation of the images to specific depths. However, geochemical data alone may be sufficient for modelling, without the need for further exhaustive data, which should enable the application of this methodology in other TSFs where aerial image data is not available.
Another approach for interpolating the particle populations could be to parameterise the distributions of the particle properties and interpolate the resulting parameters. This would, however, require some developments in the applicable probability distributions. Other than this, the geostatistical workflow was optimised and could not be further developed within this case study. The leave-one-out cross-validation results are excellent given the complexity of interpolating particle populations, and are comparable to cross-validation in more conventional, i.e., geochemistry-focused, geostatistical studies.
The main room for improvement in the applied methodology lies in the definition of the particle types. Statistical clustering methods were not applicable, and instead, manual binning was performed. In fact, neither of these approaches is ideal because they do not take the spatial dependence of the particle types into account. An opportunity to further improve the binning approach would be to redefine the particle classes to account for these spatial predictability effects. To do so, it would be necessary to assess the spatial variability of the individual particle types, and not mix those types which show some structure with those which are randomly distributed. Further testing and development are required to find a method to optimally decompose the multivariate distribution of particle properties into bins or a linear mixture of parametric sub-distributions.
Conclusion
This study applied a new and innovative combination of methods to perform geometallurgical modelling for a TSF case study. The integration of geostatistical modelling and particle binning allowed comprehensive particle-based simulations to be produced, accounting for the spatial trends in the data and providing detailed simulations of particle population distributions that could be used to calculate multiple material properties of interest and corresponding uncertainties. Any properties that are strongly associated with the sedimentary-style depositional processes, or correlate well with properties that are, can be well predicted, including mineralogical and textural properties.
However, the method developed here is complex and requires a great deal of user-input and expertise. Although the method has proven challenging to implement and validate, given the complex nature of the problem at hand, the results we achieved here are highly promising. There is naturally room for improving the method, but the work done here provides a sound foundation. Where data is available, the approach should be extended to a 3D particle-based model, although it remains to be seen if the method will remain effective when fewer samples or no exhaustive data are available, or when sedimentation processes were not as dominant in systematically controlling the spatial distributions of the particle types, such as in paste-fill TSFs.
The results of this study also underline the importance of incorporating uncertainty estimations into geometallurgical modelling. The variability in the modelled properties can be significant, and may greatly impact processing behaviour, i.e., mineral recoveries and thus the economics of re-processing. Ultimately, the aim should be to directly link the spatial particle-based model to a processing model to simulate the mining and beneficiation of the deposit. Considering the complexity of the sulphide-bearing particles, i.e., varying grain sizes and degrees of surface liberation within particles of different sizes, a good quality of prediction was achieved for the sulphide grain size and surface liberation properties. The results are well capable of informing on the processing potential and environmental behaviour of the tailings. Therefore, this study represents an important step towards the integration of geometallurgical models and particle-based process simulations, which is expected to improve the accuracy of mineral resource and reserve estimations and reduce economic risks associated with all stages of the mining value chain.
Data Availability Statement
The original contributions presented in the study are included in the article/Supplementary Material, further inquiries can be directed to the corresponding author.
Author Contributions
RB: conceptualisation, methodology, software, validation, formal analysis, investigation, resources, data curation, writing–original draft, writing–review and editing, visualisation. MF: conceptualisation, methodology, writing–review and editing, supervision, project administration. RT-D: conceptualisation, methodology, writing–review and editing. KB: formal analysis, writing–review and editing. AE: formal analysis, writing–review and editing. LP: conceptualisation, methodology, writing–review and editing. JG: conceptualisation, writing–review and editing, supervision. All authors contributed to the article and approved the submitted version.
Funding
The authors declare that financial support was received for the research, authorship, and/or publication of this article. This project received funding from the European Union’s EU Framework Programme for Research and Innovation Horizon 2020 under Grant Agreement No 812580.
Conflict of Interest
The authors declare that the research was conducted in the absence of any commercial or financial relationships that could be construed as a potential conflict of interest.
Publisher’s Note
All claims expressed in this article are solely those of the authors and do not necessarily represent those of their affiliated organizations, or those of the publisher, the editors and the reviewers. Any product that may be evaluated in this article, or claim that may be made by its manufacturer, is not guaranteed or endorsed by the publisher.
Acknowledgments
Our sincere thanks go to our late co-author AE, for all her hard work and collaborative efforts in the SULTAN European Training Network, including her contributions to this manuscript through the EPMA data acquisition and analysis. Dr Pedro Rodrigues, Associate Professor Dr Jorge M.R.S Relvas and Dr Alvaro M.M. Pinto (Universidade de Lisboa) are also thanked for their support during EPMA data acquisition, as well as fruitful discussions. We would like to acknowledge the sample preparation staff at HIF for preparing the samples for analysis. Finally, our thanks go to two reviewers for their comments which helped to improve the quality of the manuscript.
Supplementary Material
The Supplementary Material for this article can be found online at: https://www.escubed.org/articles/10.3389/esss.2024.10102/full#supplementary-material
References
Abildin, Y., Madani, N., and Topal, E. (2019). A Hybrid Approach for Joint Simulation of Geometallurgical Variables with Inequality Constraint. Minerals 9, 24. doi:10.3390/min9010024
Adeli, A., Dowd, P., Emery, X., and Xu, C. (2021). Using Cokriging to Predict Metal Recovery Accounting for Non-Additivity and Preferential Sampling Designs. Miner. Eng. 170, 106923. doi:10.1016/j.Mineng.2021.106923
Álvarez, M. L., Méndez, A., Rodríguez-Pacheco, R., Paz-Ferreiro, J., and Gascó, G. (2021). Recovery of Zinc and Copper from mine Tailings by Acid Leaching Solutions Combined with Carbon-Based Materials. Appl. Sci. 11, 5166. doi:10.3390/app11115166
Araya, N., Ramírez, Y., Kraslawski, A., and Cisternas, L. A. (2021). Feasibility of Re-Processing Mine Tailings to Obtain Critical Raw Materials Using Real Options Analysis. J. Environ. Manag. 284, 112060. doi:10.1016/j.jenvman.2021.112060
Babel, B., Penz, M., Schach, E., Boehme, S., and Rudolph, M. (2018). Reprocessing of a Southern Chilean Zn Tailing by Flotation—A Case Study. Minerals 8, 295. doi:10.3390/min8070295
Bevandić, S., Blannin, R., Escobar, A. G., Bachmann, K., Frenzel, M., Pinto, Á. M. M., et al. (2022). Metal Deportment in Pb-Zn mine Wastes from a Historic Tailings Pond, Plombières, East Belgium. Miner. Eng. 184, 107628. doi:10.1016/j.Mineng.2022.107628
Bilal, M., Park, I., Hornn, V., Ito, M., Hassan, F., Jeon, S., et al. (2022). The Challenges and Prospects of Recovering Fine Copper Sulfides from Tailings Using Different Flotation Techniques: A Review. Minerals 12, 586. doi:10.3390/min12050586
Blannin, R., Frenzel, M., and Gutzmer, J. (2022a). “Predictive Modelling of Mineralogical and Properties of Tailings Using Geochemical Data Textural,” in Proceedings of the 16th SGA Biennial Meeting. Editor A. B. Christie (Rotorua, New Zealand: Society for Geology Applied to Mineral Deposits), 25–28.
Blannin, R., Frenzel, M., Tolosana-Delgado, R., Büttner, P., and Gutzmer, J. (2023). 3D Geostatistical Modelling of a Tailings Storage Facility: Resource Potential and Environmental Implications. Ore Geol. Rev. 154, 105337. doi:10.1016/j.oregeorev.2023.105337
Blannin, R., Frenzel, M., Tolosana-Delgado, R., and Gutzmer, J. (2022b). Towards a Sampling Protocol for the Resource Assessment of Critical Raw Materials in Tailings Storage Facilities. J. Geochem. Explor. 236, 106974. doi:10.1016/j.gexplo.2022.106974
Blannin, R., Frenzel, M., Tusa, L., Birtel, S., Ivascanu, P., Baker, T., et al. (2021). Uncertainties in Quantitative Mineralogical Studies Using Scanning Electron Microscope-Based Image Analysis. Miner. Eng. 167, 106836. doi:10.1016/j.mineng.2021.106836
Boisvert, J. B., Rossi, M. E., Ehrig, K., and Deutsch, C. V. (2013). Geometallurgical Modeling at Olympic Dam Mine, South Australia. Math. Geosci. 45, 901–925. doi:10.1007/s11004-013-9462-5
Büttner, P., Osbahr, I., Zimmermann, R., Leißner, T., Satge, L., and Gutzmer, J. (2018). Recovery Potential of Flotation Tailings Assessed by Spatial Modelling of Automated Mineralogy Data. Miner. Eng. 116, 143–151. doi:10.1016/j.mineng.2017.09.008
Coelho Braga de Carvalho, A. L., Coelho Braga de Carvalho, V. A., Blannin, R., Escobar, A. G., Frenzel, M., Rudolph, M., et al. (2023). A Study on the Desulfurization of Sulfidic Mine Tailings for the Production of a Sulfur-Poor Residue. Miner. Eng. 202, 108285. doi:10.1016/j.mineng.2023.108285
Coward, S., Vann, J., Dunham, S., and Stewart, M. (2009). “The Primary-Response Framework for Geometallurgical Variables,” in Proceedings of the International Mining Geology Conference, Perth, Australia (Melbourne, Australia: Australasian Institute of Mining and Metallurgy), 17–19.
Deutsch, C. V., and Journel, A. G. (1998). GSLIB: Geostatistical Software Library and User’s Guide. New York: Oxford University Press.
Deutsch, J. L., Palmer, K., Deutsch, C. V., Szymanski, J., and Etsell, T. H. (2016). Spatial Modeling of Geometallurgical Properties: Techniques and a case Study. Nat. Resour. Res. 25, 161–181. doi:10.1007/s11053-015-9276-x
Dold, B. (2014). Evolution of Acid Mine Drainage Formation in Sulphidic mine Tailings. Minerals 4, 621–641. doi:10.3390/min4030621
Dold, B. (2017). Acid Rock Drainage Prediction: A Critical Review. J. Geochem. Explor. 172, 120–132. doi:10.1016/j.gexplo.2016.09.014
Dold, B. (2020). Sourcing of Critical Elements and Industrial Minerals from Mine Waste – The Final Evolutionary Step Back to Sustainability of Humankind? J. Geochem. Explor. 219, 106638. doi:10.1016/j.gexplo.2020.106638
Dominy, S. C., O’Connor, L., Parbhakar-Fox, A., Glass, H., and Purevgerel, S. (2018). Geometallurgy—A Route to More Resilient mine Operations. Minerals 8, 560. doi:10.3390/min8120560
Drif, B., Taha, Y., Hakkou, R., and Benzaazoua, M. (2021). Integrated Valorization of Silver Mine Tailings Through Silver Recovery and Ceramic Materials Production. Miner. Eng. 170, 107060. doi:10.1016/j.mineng.2021.107060
Efron, B. (1979). Bootstrap Methods: Another Look at the Jackknife. Ann. Statistics 7, 1–26. doi:10.1214/aos/1176344552
El-bouazzaoui, A., Ait-khouia, Y., Chopard, A., Demers, I., and Benzaazoua, M. (2022). Environmental Desulfurization of Mine Tailings Using Froth Flotation: The Case of Amaruq mine (Nunavut, Canada). Miner. Eng. 187, 107762. doi:10.1016/j.Mineng.2022.107762
Elghali, A., Benzaazoua, M., Bouzahzah, H., Abdelmoula, M., Dynes, J. J., and Jamieson, H. E. (2021). ROLE of Secondary Minerals in the Acid Generating Potential of Weathered mine Tailings: Crystal-Chemistry Characterization and Closed Mine Site Management Involvement. Sci. Total Environ. 784, 147105. doi:10.1016/j.scitotenv.2021.147105
Elghali, A., Benzaazoua, M., Bussière, B., Kennedy, C., Parwani, R., and Graham, S. (2019). The ROLE of Hardpan Formation on the Reactivity of Sulfidic mine Tailings: A case Study at Joutel Mine (Québec). Sci. Total Environ. 654, 118–128. doi:10.1016/j.scitotenv.2018.11.066
Elghali, A., Benzaazoua, M., Taha, Y., Amar, H., Ait-khouia, Y., Bouzahzah, H., et al. (2023). Prediction of Acid mine Drainage: Where We Are. Earth-Science Rev. 241, 104421. doi:10.1016/j.earscirev.2023.104421
Fandrich, R., Gu, Y., Burrows, D., and Moeller, K. (2007). Modern SEM-Based Mineral Liberation Analysis. Int. J. Mineral Process. 84, 310–320. doi:10.1016/j.minpro.2006.07.018
Franks, D. M., Stringer, M., Torres-Cruz, L. A., Baker, E., Valenta, R., Thygesen, K., et al. (2021). Tailings Facility Disclosures Reveal Stability Risks. Sci. Rep. 11, 5353–5357. doi:10.1038/s41598-021-84897-0
Frenzel, M., Baumgartner, R., Tolosana-Delgado, R., and Gutzmer, J. (2023). Geometallurgy: Present and Future. Elements 19, 345–351. doi:10.2138/gselements.19.6.345
Fritz, E., and Jahns, C. (2017). Die Spülhalde Davidschacht in Freiberg – Geschichte. Umweltprobl. geplante Sanier. 2, 4–17.
Gaudin, A. M. (1939). Principles of Mineral Dressing. New York and London: McGraw-Hill Book Company.
G.E.O.S. (1993). Bericht zur Gefährdungsabschätzung der Davidschacht-Spülhalde. G.E.O.S. Freiberg Ingenieurgesellschaft mbH. Freiberg, Germany: G.E.O.S.
Golev, A., Gallagher, L., Vander Velpen, A., Lynggaard, J. R., Friot, D., Stringer, M., et al. (2022). Ore-Sand: A Potential New Solution to the Mine Tailings and Global Sand Sustainability Crises. Geneva: The University of Queensland & University of Geneva.
Goovaerts, P. (1997). Geostatistics for Natural Resources Evaluation. New York: Oxford University Press.
Gou, M., Zhou, L., and Then, N. W. Y. (2019). Utilization of Tailings in Cement and Concrete: A Review. Sci. Eng. Compos. Mater. 26, 449–464. doi:10.1515/secm-2019-0029
Gräler, B., Pebesma, E., and Heuvelink, G. (2016). Spatio-Temporal Interpolation Using Gstat. R J. 8, 204–218. doi:10.32614/RJ-2016-014
Guanira, K., Valente, T. M., Ríos, C. A., Castellanos, O. M., Salazar, L., Lattanzi, D., et al. (2020). Methodological Approach for Mineralogical Characterization of Tailings from a Cu(Au,Ag) Skarn Type Deposit Using QEMSCAN (Quantitative Evaluation of Minerals by Scanning Electron Microscopy). J. Geochem. Explor. 209, 106439. doi:10.1016/j.gexplo.2019.106439
Helser, J., Perumal, P., and Cappuyns, V. (2022a). Valorizing (Cleaned) Sulfidic mine Waste as a Resource for Construction Materials. J. Environ. Manag. 319, 115742. doi:10.1016/j.jenvman.2022.115742
Helser, J., Vassilieva, E., and Cappuyns, V. (2022b). Environmental and Human Health Risk Assessment of Sulfidic Mine Waste: Bioaccessibility, Leaching and Mineralogy. J. Hazard. Mater. 424. doi:10.1016/j.jhazmat.2021.127313
Herrington, R. (2021). Mining Our Green Future. Nat. Rev. Mater. 6, 456–458. doi:10.1038/s41578-021-00325-9
Hoal, K. E. O., and Frenzel, M. (2022). ORES Drive Operations—Economic Geology Is the Foundation of Geometallurgy. Seg. Discov., 30–43. doi:10.5382/Geo-and-Mining-15
Hunt, J., Berry, R., Becker, M., and Baumgartner, R. (2019). A Special Issue Dedicated to Geometallurgy: Preface. Econ. Geol. 114, 1473–1479. doi:10.5382/econgeo.4688
Jain, A. K., Murty, M. N., and Flynn, P. J. (1999). Data Clustering: A Review. ACM Comput. Surv. 31 (3), 264–323. doi:10.1145/331499.331504
Jambor, J. L., Dutrizac, J. E., and Raudsepp, M. (2007). Measured and Computed Neutralization Potentials from Static Tests of Diverse ROCK Types. Environ. Geol. 52, 1019–1031. doi:10.1007/s00254-006-0542-4
Kamariah, N., Kalebic, D., Xanthopoulos, P., Blannin, R., Araujo, F. P., Koelewijn, S.-F., et al. (2022). Conventional Versus Microwave-Assisted Roasting of Sulfidic Tailings: Mineralogical Transformation and Metal Leaching Behavior. Miner. Eng. 183, 107587. doi:10.1016/j.Mineng.2022.107587
Karacan, C. Ö., Erten, O., and Martín-Fernández, J. A. (2023). Assessment of Resource Potential from mine Tailings Using Geostatistical Modeling for Compositions: A Methodology and Application to Katherine Mine Site, Arizona, USA. J. Geochem. Explor. 245, 107142. doi:10.1016/j.gexplo.2022.107142
Karhu, M., Lagerbom, J., Solismaa, S., Honkanen, M., Ismailov, A., Räisänen, M.-L., et al. (2019). Mining Tailings as Raw Materials for Reaction-Sintered Aluminosilicate Ceramics: Effect of Mineralogical Composition on Microstructure and Properties. Ceram. Int. 45, 4840–4848. doi:10.1016/j.ceramint.2018.11.180
King, R. P., Schneider, C. L., and King, E. A. (2012). Modeling and Simulation of Mineral Processing Systems. 2nd ed. Englewood, California: Society for Mining, Metallurgy, and Exploration.
Kinnunen, P., Karhu, M., Yli-Rantala, E., Kivikytö-Reponen, P., and Mäkinen, J. (2022). A Review of Circular Economy Strategies for mine Tailings. Clean. Eng. Technol. 8, 100499. doi:10.1016/j.clet.2022.100499
Kupka, N., Tolosana-Delgado, R., Schach, E., Bachmann, K., Heinig, T., and Rudolph, M. (2020). R as an Environment for data Mining of Process Mineralogy Data: A Case Study of an Industrial Rougher Flotation BANK. Miner. Eng. 146, 106111. doi:10.1016/j.Mineng.2019.106111
Lawrence, R., and Wang, Y. (1996). Determination of Neutralization Potential for Acid Rock Drainage Prediction. Ottowa, ON: MEND. MEND Project Report 1.16.3.
Li, L., Romary, T., and Caers, J. (2015). Universal Kriging with Training Images. Spat. Stat. 14, 240–268. doi:10.1016/j.spasta.2015.04.004
Lindsay, M. B. J., Moncur, M. C., Bain, J. G., Jambor, J. L., Ptacek, C. J., and Blowes, D. W. (2015). Geochemical and Mineralogical Aspects of Sulfide mine Tailings. Appl. Geochem. 57, 157–177. doi:10.1016/j.apgeochem.2015.01.009
Lishchuk, V., Lund, C., and Ghorbani, Y. (2019). Evaluation and Comparison of Different Machine-Learning Methods to Integrate Sparse Process data INTO a Spatial Model in Geometallurgy. Miner. Eng. 134, 156–165. doi:10.1016/j.Mineng.2019.01.032
Lottermoser, B. G. (2011). Recycling, Reuse and Rehabilitation of mine Wastes. Elements 7, 405–410. doi:10.2113/gselements.7.6.405
Louwrens, E. L. (2016). A Novel Geometallurgical Approach to Tailings Storage Facility Characterisation and Evaluation. Brisbane, Australia: The University of Queensland. doi:10.14264/uql.2016.935
Mabroum, S., Moukannaa, S., El Machi, A., Taha, Y., Benzaazoua, M., and Hakkou, R. (2020). Mine Wastes Based Geopolymers: A Critical Review. Clean. Eng. Technol. 1, 100014. doi:10.1016/j.clet.2020.100014
Mäkinen, J., Salo, M., Khoshkhoo, M., Sundkvist, J. E., and Kinnunen, P. (2020). Bioleaching of Cobalt from Sulfide Mining Tailings; a Mini-Pilot Study. Hydrometallurgy 196, 105418. doi:10.1016/j.hydromet.2020.105418
Manca, P. P., Massacci, G., Pintus, D., and Sogos, G. (2021). The Flotation of Sphalerite mine Tailings as a Remediation Method. Miner. Eng. 165, 106862. doi:10.1016/j.Mineng.2021.106862
Martin, M., Janneck, E., Kermer, R., Patzig, A., and Reichel, S. (2015). Recovery of Indium from Sphalerite Ore and Flotation Tailings by Bioleaching and Subsequent Precipitation Processes. Miner. Eng. 75, 94–99. doi:10.1016/j.mineng.2014.11.015
Martins, N. P., Srivastava, S., Veiga Simão, F., Niu, H., Perumal, P., Snellings, R., et al. (2021). Exploring the Potential for Utilization of Medium and Highly Sulfidic Mine Tailings in Construction Materials: A Review. Sustainability 13, 12150. doi:10.3390/su132112150
Matheron, G. (1969). Le Krigeage Universel, vol 1. Fontainebleau: Cahiers du Centre de Morphologie Mathématique, École des Mines de Paris.
Mejías, O., Parbhakar-Fox, A., Jackson, L., Valenta, R., and Townley, B. (2023). Indium in Ore Deposits and mine Waste Environments: Geochemistry, Mineralogy, and Opportunities for Recovery. J. Geochem. Explor. 255, 107312. doi:10.1016/j.gexplo.2023.107312
Mena Silva, C. A., Ellefmo, S. L., Sandøy, R., Sørensen, B. E., and Aasly, K. (2020). A Neural Network Approach for Spatial Variation Assessment – A Nepheline Syenite case Study. Miner. Eng. 149, 106178. doi:10.1016/j.Mineng.2019.106178
Mulenshi, J., Khavari, P., Chehreh Chelgani, S., and Rosenkranz, J. (2019). Characterization and Beneficiation Options for Tungsten Recovery from Yxsjöberg Historical Ore Tailings. Processes 7, 895. doi:10.3390/pr7120895
Nikonow, W., Rammlmair, D., and Furche, M. (2019). A Multidisciplinary Approach Considering Geochemical Reorganization and Internal Structure of Tailings Impoundments for Metal Exploration. Appl. Geochem. 104, 51–59. doi:10.1016/j.apgeochem.2019.03.014
Niu, H., Abdulkareem, M., Sreenivasan, H., Kantola, A. M., Havukainen, J., Horttanainen, M., et al. (2020). Recycling Mica and Carbonate-Rich mine Tailings in Alkali-Activated Composites: A Synergy with Metakaolin. Miner. Eng. 157, 106535. doi:10.1016/j.Mineng.2020.106535
Niu, H., Helser, J., Corfe, I. J., Kuva, J., Butcher, A. R., Cappuyns, V., et al. (2022). Incorporation of Bioleached Sulfidic mine Tailings in One-Part Alkali-Activated Blast Furnace Slag Mortar. Constr. Build. Mater. 333, 127195. doi:10.1016/j.conbuildmat.2022.127195
Noble, T. L., Lottermoser, B. G., and Parbhakar-Fox, A. (2015). Evaluation of pH Testing Methods for Sulfidic Mine Waste. Mine Water Environ. 35, 318–331. doi:10.1007/s10230-015-0356-2
Opara, C. B., Blannin, R., Ebert, D., Frenzel, M., Pollmann, K., and Kutschke, S. (2022). Bioleaching of Metal(loid)s from Sulfidic mine Tailings and Waste Rock from the Neves Corvo Mine, Portugal, by an Acidophilic Consortium. Miner. Eng. 188, 107831. doi:10.1016/j.mineng.2022.107831
Parbhakar-Fox, A., and Baumgartner, R. (2023). Action Versus Reaction: How Geometallurgy Can Improve Mine Waste Management Across the Life-Of-Mine. Elements 19, 371–376. doi:10.2138/gselements.19.6.371
Parbhakar-Fox, A., Lottermoser, B., Hartner, R., Berry, R. F., and Noble, T. L. (2016). “Prediction of Acid Rock Drainage from Automated Mineralogy,” in Environmental Indicators in Metal Mining. Editor B. Lottermoser (Cham: Springer), 318–331.
Pebesma, E. J. (2004). Multivariable Geostatistics in S: The Gstat Package. Comput. & Geosciences 30, 683–691. doi:10.1016/j.cageo.2004.03.012
Pereira, L., Frenzel, M., Buchmann, M., Kern, M., Tolosana-Delgado, R., Gerald van den Boogaart, K., et al. (2022). Testing the Robustness of Particle-Based Separation Models for the Magnetic Separation of a Complex Skarn Ore. Int. J. Min. Sci. Technol. 32, 645–655. doi:10.1016/j.ijmst.2022.01.008
Pereira, L., Frenzel, M., Hoang, D. H., Tolosana-Delgado, R., Rudolph, M., and Gutzmer, J. (2021a). Computing Single-Particle Flotation Kinetics Using Automated Mineralogy Data and Machine Learning. Miner. Eng. 170, 107054. doi:10.1016/j.mineng.2021.107054
Pereira, L., Frenzel, M., Khodadadzadeh, M., Tolosana-Delgado, R., and Gutzmer, J. (2021b). A Self-Adaptive Particle-Tracking Method for Minerals Processing. J. Clean. Prod. 279, 123711. doi:10.1016/j.jclepro.2020.123711
Pereira, L., Schach, E., Tolosana-Delgado, R., and Frenzel, M. (2023). All About Particles: Modelling Ore Behaviour in Mineral Processing. Elements 19, 359–364. doi:10.2138/gselements.19.6.359
Peterson, R. A. (2021). Finding Optimal Normalizing Transformations Via bestNormalize. R J. 13, 310–320. doi:10.32614/RJ-2021-041
Peterson, R. A., and Cavanaugh, J. E. (2020). Ordered Quantile Normalization: A Semiparametric Transformation Built for the Cross-Validation Era. J. Appl. Statistics 47, 2312–2327. doi:10.1080/02664763.2019.1630372
Prior, Á., Tolosana-Delgado, R., van den Boogaart, K. G., and Benndorf, J. (2021). Resource Model Updating for Compositional Geometallurgical Variables. Math. Geosci. 53, 945–968. doi:10.1007/s11004-020-09874-1
R Core Team (2021). R: A Language and Environment for Statistical Computing. Vienna, Austria: R Foundation for Statistical Computing.
Redwan, M., Rammlmair, D., and Meima, J. A. (2012). Application of Mineral Liberation Analysis in Studying Micro-Sedimentological Structures Within Sulfide Mine Tailings and Their Effect on Hardpan Formation. Sci. Total Environ. 414, 480–493. doi:10.1016/j.scitotenv.2011.10.038
Reynier, N., Gagné-Turcotte, R., Coudert, L., Costis, S., Cameron, R., and Blais, J.-F. (2021). Bioleaching of Uranium Tailings as Secondary Sources for Rare Earth Elements Production. Minerals 11, 302. doi:10.3390/min11030302
Rincon, J., Gaydardzhiev, S., and Stamenov, L. (2019a). Investigation on the Flotation Recovery of Copper Sulphosalts Through an Integrated Mineralogical Approach. Miner. Eng. 130, 36–47. doi:10.1016/j.mineng.2018.10.006
Rincon, J., Gaydardzhiev, S., and Stamenov, L. (2019b). Coupling Comminution Indices and Mineralogical Features as an Approach to a Geometallurgical Characterization of a Copper Ore. Miner. Eng. 130, 57–66. doi:10.1016/j.Mineng.2018.10.007
Ristović, I., Štyriaková, D., Štyriaková, I., Šuba, J., and Širadović, E. (2022). Bioleaching Process for Copper Extraction from Waste in Alkaline and Acid Medium. Minerals 12, 100. doi:10.3390/min12010100
Romero-García, A., Iglesias-González, N., Romero, R., Lorenzo-Tallafigo, J., Mazuelos, A., and Carranza, F. (2019). Valorisation of a Flotation Tailing by Bioleaching and Brine Leaching, Fostering Environmental Protection and Sustainable Development. J. Clean. Prod. 233, 573–581. doi:10.1016/j.jclepro.2019.06.118
Rossi, M. E., and Deutsch, C. V. (2014). Mineral Resource Estimation. Dordrecht: Springer. doi:10.1007/978-1-4020-5717-5
Rupprecht, S. M. (2020). “Consideration for Declaring a Mineral Reserve for TSF Mining Projects,”J. South. Afr. Inst. Min. Metall. 120, 515–520. doi:10.17159/2411-9717/1246/2020
Sakamoto, Y., Ishiguro, M., and Kitagawa, G. (1986). Akaike Information Criterion Statistics. Netherlands: Springer.
Sarkar, S., Melnykov, V., and Zheng, R. (2020). Gaussian Mixture Modeling and Model-Based Clustering under Measurement Inconsistency. Adv. Data Analysis Classif. 14, 379–413. doi:10.1007/s11634-020-00393-9
Schach, E., Buchmann, M., Tolosana-Delgado, R., Leißner, T., Kern, M., van den Boogaart, G., et al. (2019). Multidimensional Characterization of Separation Processes – PART 1: Introducing Kernel Methods and Entropy in the Context of Mineral Processing Using SEM-Based Image Analysis. Miner. Eng. 137, 78–86. doi:10.1016/j.mineng.2019.03.026
Schueler, T. A., de Aguiar, P. F., Vera, Y. M., and Goldmann, D. (2021). Leaching of Cu, Zn, and Pb from Sulfidic Tailings Under the Use of Sulfuric Acid and Chloride Solutions. J. Sustain. Metallurgy 7, 1523–1536. doi:10.1007/s40831-021-00446-z
Schulz, B., Sandmann, D., and Gilbricht, S. (2020). SEM-Based Automated Mineralogy and its Application in Geo- and Material Sciences. Minerals 10, 1004. doi:10.3390/min10111004
Scrucca, L., Fop, M., Murphy, T. B., and Raftery, A. E. (2016). Mclust 5: Clustering, Classification and Density Estimation Using Gaussian Finite Mixture Models. R J. 8, 289. doi:10.32614/rj-2016-021
Simate, G. S., and Ndlovu, S. (2014). Acid Mine Drainage: Challenges and Opportunities. J. Environ. Chem. Eng. 2, 1785–1803. doi:10.1016/j.jece.2014.07.021
Swinkels, L. J., Schulz-Isenbeck, J., Frenzel, M., Gutzmer, J., and Burisch, M. (2021). Spatial and Temporal Evolution of the Freiberg Epithermal Ag-Pb-Zn District, Germany. Econ. Geol. 116, 1649–1667. doi:10.5382/econgeo.4833
Switzer, P., and Green, A. A. (1984). Min/Max Autocorrelation Factors for Multivariate Spatial Imaging, Tehcnical Report 6, Department of Statistics. Stanford University.
Tolosana-Delgado, R., and Mueller, U. (2021a). gmGeostats: Geostatistics for Compositional Analysis, Version 0.11.0-9002. R. package. Available at: https://gitlab.hzdr.de/geomet/gmGeostats.
Tolosana-Delgado, R., and Mueller, U. (2021b). Geostatistics for Compositional data with R. Cham: Springer. doi:10.1007/978-3-030-82568-3
Tolosana-Delgado, R., Mueller, U., and van den Boogaart, K. G. (2019). Geostatistics for Compositional Data, an Overview. Math. Geosci. 51, 485–526. doi:10.1007/s11004-018-9769-3
Trahar, W. J. (1981). A Rational Interpretation of the ROLE of Particle SIZE in Flotation. Int. J. Mineral Process. 8, 289–327. doi:10.1016/0301-7516(81)90019-3
Tripodi, E. E. M., Rueda, J. A. G., Céspedes, C. A., Vega, J. D., and Gómez, C. C. (2019). Characterization and Geostatistical Modelling of Contaminants and Added Value Metals from an Abandoned Cu–Au Tailing Dam in Taltal (Chile). J. S. Am. Earth Sci. 93, 183–202. doi:10.1016/j.jsames.2019.05.001
Tungpalan, K., Wightman, E., Keeney, L., and Manlapig, E. (2021). A Geometallurgical Approach for Predicting Separation Performance. Miner. Eng. 171, 107065. doi:10.1016/j.mineng.2021.107065
Valenta, R. K., Lèbre, É., Antonio, C., Franks, D. M., Jokovic, V., Micklethwaite, S., et al. (2023). Decarbonisation to Drive Dramatic Increase in Mining Waste–Options for Reduction. Resour. Conservation Recycl. 190, 106859. doi:10.1016/j.resconrec.2022.106859
van den Boogaart, K. G., Tolosana-Delgado, R., and Bren, M. (2021). Compositions: Compositional data Analysis. R. package version 2. 0-1.
Veiga Simão, F., Chambart, H., Vandemeulebroeke, L., and Cappuyns, V. (2021a). Incorporation of Sulphidic Mining Waste Material in Ceramic ROOF Tiles and Blocks. J. Geochem. Explor. 225, 106741. doi:10.1016/j.gexplo.2021.106741
Veiga Simão, F., Chambart, H., Vandemeulebroeke, L., Nielsen, P., and Cappuyns, V. (2021b). Turning Mine Waste into a Ceramic Resource: Plombières Tailing Case. J. Sustain. Metallurgy 7, 1469–1482. doi:10.1007/s40831-021-00442-3
Vick, S. G. (1990). Planning, Design, and Analysis of Tailings Dams. Vancouver: BiTech Publishers Ltd.
Vitti, C., and Arnold, B. J. (2022). The Reprocessing and Revalorization of Critical Minerals in mine Tailings. Min. Metallurgy Explor. 39, 49–54. doi:10.1007/s42461-021-00524-6
Weightman, E., Craw, D., Snow, T., Christenson, H., and Kerr, G. (2021). Stratigraphy and Mineralogy of Tailings at Macraes Gold Mine, Southern New Zealand. N. Z. J. Geol. Geophys. 65, 422–438. doi:10.1080/00288306.2021.1931360
Whitworth, A. J., Forbes, E., Verster, I., Jokovic, V., Awatey, B., and Parbhakar-Fox, A. (2022). Review on Advances in Mineral Processing Technologies Suitable for Critical Metal Recovery from Mining and Processing Wastes. Clean. Eng. Technol. 7, 100451. doi:10.1016/j.clet.2022.100451
Wills, B. A., and Finch, J. (2015). Wills’ Mineral Processing Technology: An Introduction to the Practical Aspects of Ore Treatment and Mineral Recovery. 8th ed. Amsterdam: Elsevier. doi:10.1016/C2010-0-65478-2
Keywords: geostatistics, modelling, automated mineralogy, particle data, resource potential, acid mine drainage, mine waste
Citation: Blannin R, Frenzel M, Tolosana-Delgado R, Bachmann K, Escobar AG, Pereira L and Gutzmer J (2024) A Quantitative Particle-Based Approach for the Geometallurgical Assessment of Tailings Deposits. Earth Sci. Syst. Soc. 4:10102. doi: 10.3389/esss.2024.10102
Received: 28 November 2023; Accepted: 20 August 2024;
Published: 17 September 2024.
Edited by:
Rebecca Stokes, United States Department of the Interior, United StatesReviewed by:
Denise Levitan, United States Department of the Interior, United StatesAbdellatif Elghali, Mohammed VI Polytechnic University, Morocco
Copyright © 2024 Blannin, Frenzel, Tolosana-Delgado, Bachmann, Escobar, Pereira and Gutzmer. This is an open-access article distributed under the terms of the Creative Commons Attribution License (CC BY). The use, distribution or reproduction in other forums is permitted, provided the original author(s) and the copyright owner(s) are credited and that the original publication in this journal is cited, in accordance with accepted academic practice. No use, distribution or reproduction is permitted which does not comply with these terms.
*Correspondence: Rosie Blannin, ci5ibGFubmluQHVxLmVkdS5hdQ==
†Deceased